HYDROCARBON
ENGINEERING
24
Supplying more than 5000m
3
of LNG
Small and medium sized LNG (import) terminals cannot accept large
ocean going LNG vessels. They source their LNG from nearby
import terminals via short sea shipping.
Apart from some anecdotal transactions, international short
sea shipping of LNG in amounts above 5000 m
3
in Northwest
Europe started with the commissioning of the small scale
liquefaction plant in Risavika, Norway, and the small scale import
terminal in Nynashamn, Sweden, in 2011. At that moment, short sea
shipping started to be performed routinely by the 7500 m
3
Coral Methane
and later by the 15 600 m
3
Coral Energy
.
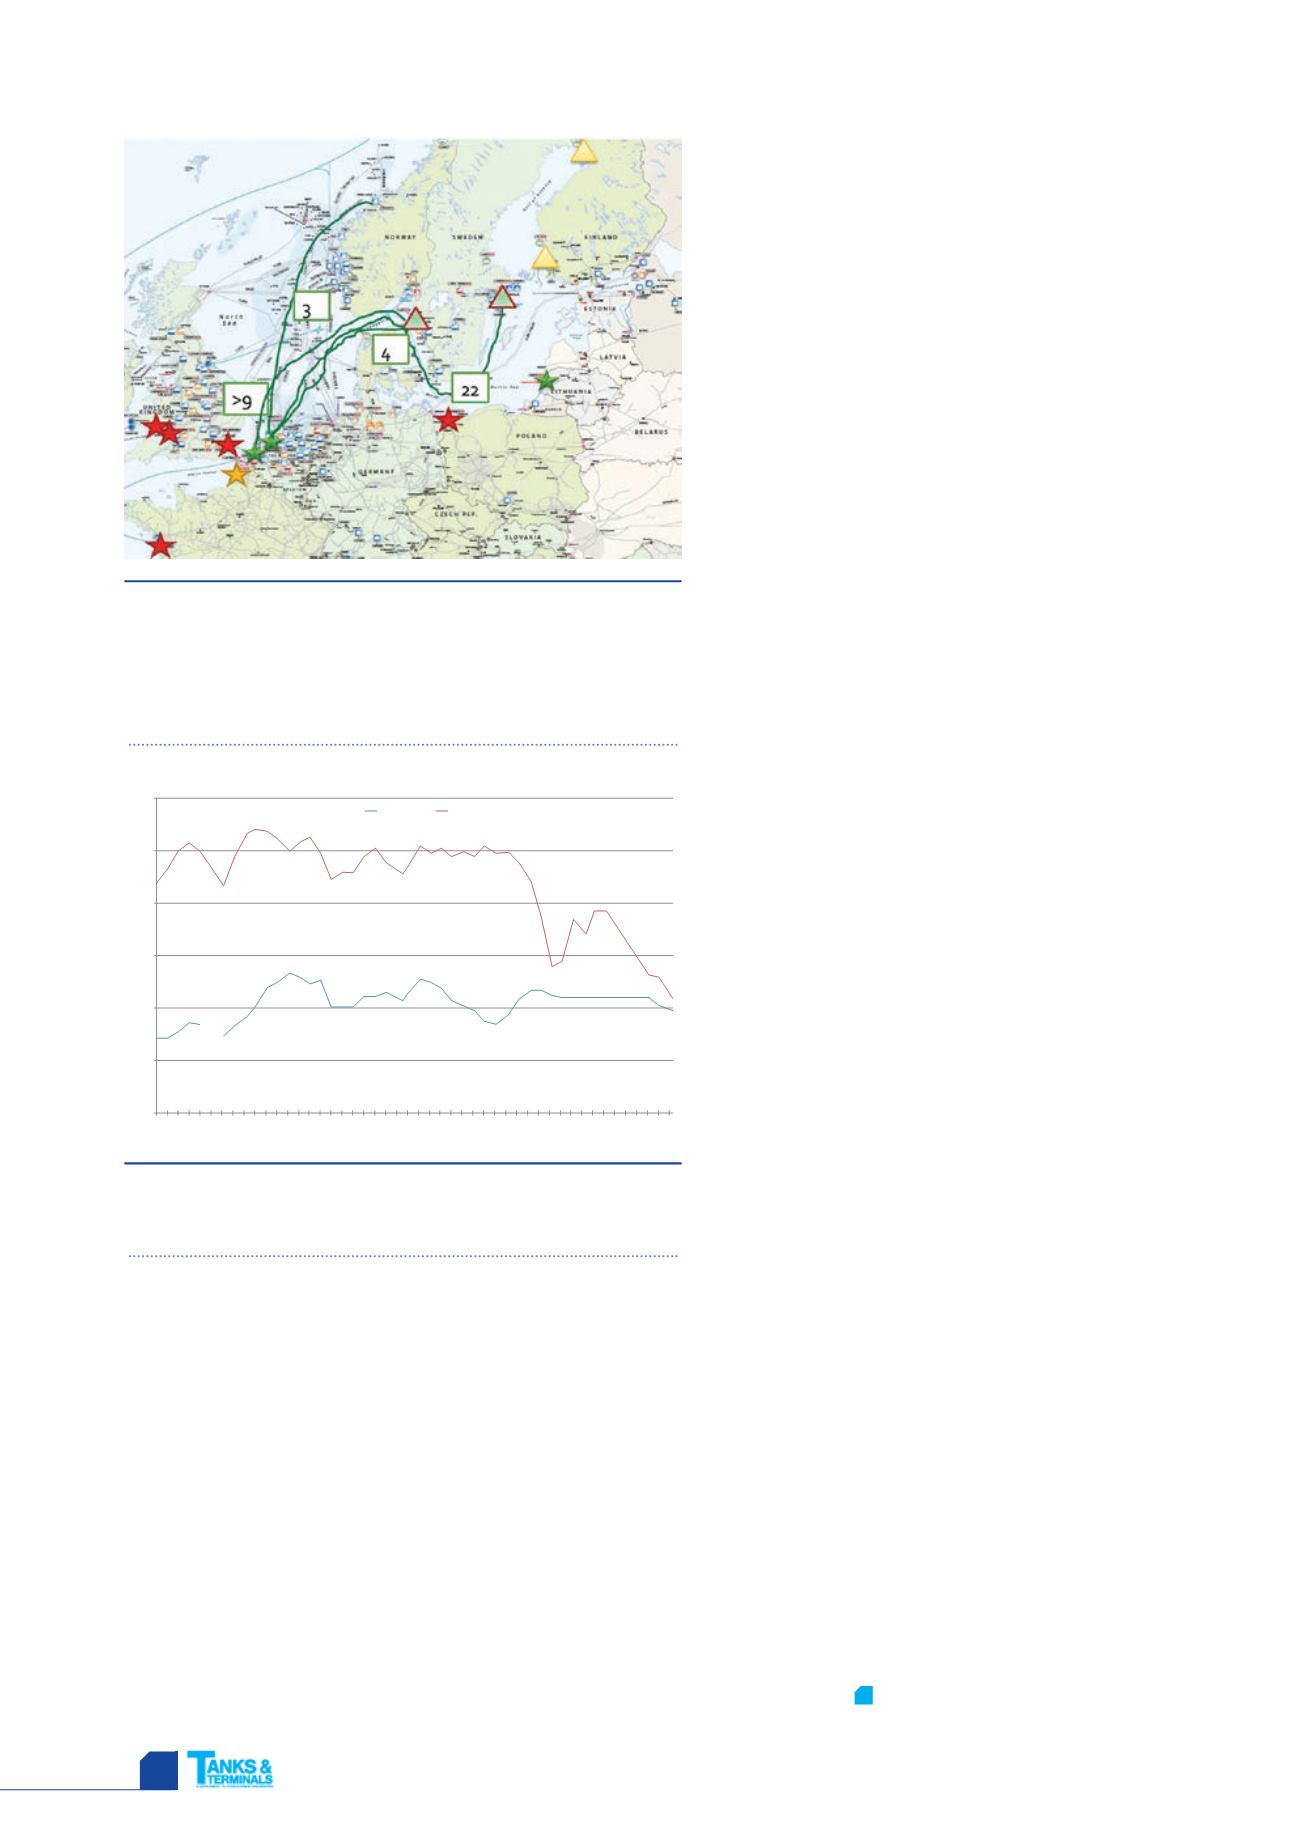
As can be seen from Figure 4, several structural short sea LNG
shipping routes have emerged. Deliveries to Nynashamn from Gate
in Rotterdam started in 2013 and were complemented in 2014 by
deliveries to Lysekil, also Sweden, which also received supply from
Risavika. In 2015, the
Coral Energy
also started reloading at
Figure 4.
Example of reach of shortsea between Northwest
Europe and Scandinavia (from 2013). The stars indicate large
scale import terminals, the triangles indicate small scale
import terminals, and the colours indicate whether small
scale reload is operational, under construction, or not yet
available. Norway is not indicated. Adapted from GLE.
Figure 5.
Price of LNG at a truck filling station in
€/kg, compared with Dutch advice price for diesel in €/l.
Source: LNG 24.
Zeebrugge towards Lysekil, and the
Coral Methane
delivered LNG from Gate in Rotterdam to Norway.
The short sea LNG fleet, which currently comprises the
Coral Methane
, the
Coral Energy
and the
Coral Anthelia
, will
be extended in 2018 by an 18 000 m
3
vessel, also from
Antony Veder. Evergas has various multi-gas carriers in
operation, and recently decided to order additional LEG
vessels to free up some of its 27 500 m
3
multi-gas vessels for
LNG trade. Norgas, which operates multi-gas carriers in the
10 000 - 12 000 m
3
range, has also indicated its intention to
focus on LNG.
What can be observed from this is the start of a well
connected network, which should make it easier for
companies to decide on new small scale terminals. It is clear
that LNG distribution infrastructure is subject to a dynamic
environment, but polls at LNG conferences also indicate that
infrastructure is no longer considered as a main hindrance for
LNG development.
The end customer
With a favourable regulatory environment, and the
availability of LNG at any place in Northwest Europe in any
quantity, price becomes the key issue. The graph in Figure 5
compares prices of diesel and LNG at a truck filling station in
the Netherlands. It underlines the dramatic impact of the
falling oil prices on business cases. Contrary to China, LNG
fuelled trucks in Europe are still much more expensive than
diesel trucks (around
€
30 000 difference). Assuming a fuel
consumption of 25 kg LNG versus 30 l of diesel per 100 km, it
can easily be calculated that, even for 100 000 km of annual
mileage, the LNG proposal was attractive.
Although take up of LNG by trucks and vessels has been
slower than generally anticipated a couple of years ago, it is
encouraging that, even in the current challenging market
environment, parties still opt for LNG as a fuel (the order
book for LNG fuelled ships is not decreasing) based on
expectations of rising oil prices and/or the environmental
advantages (e.g., silent trucks can deliver to shops 24 hours a
day). The competitive position of LNG as a fuel should
further improve as this nascent industry continues to roll out
further infrastructure – the number of truck filling stations in
Northwest Europe is still patchy but various companies have
announced their intention to fill in the gaps.
Conclusion
The LNG infrastructure industry has shown its ability to
provide all the equipment and services, when and where
required. Bunkering vessels are on order, LNG terminals offer
truck loading services, small terminals have been built, short
sea ships are sailing, ports have bunker locations, and truck
filling stations are being rolled out. Competing with a well
established oil distribution network was never going to be
easy, and the oil price slide has made it much more difficult
for end customers to switch. However, a critical mass of
supply and demand is in place, and with every investment
announcement the distribution costs can be reduced, while
flexibility and robustness increases. The LNG distribution
chain approaches the reversed ‘chicken or the egg’ situation:
infrastructure allows demand to grow, which in turn allows
new infrastructure.
T&T
shistorie van LNGen ter vergelijkingwordt de dieselprijs* ookweergegeven.
LA) prijs isafkomstig vandewebsite vanUniitedConsumers, dezewordt dagelijks vastgesteld op basis van hetgemiddelde van de landelijkeadviesprijzen van de vijfgrootsteoliemaatschappijen.
Grafiek
G prijsDiesel
PrijzenLNG vsdiesel
g
€ / liter
inclBTW
1.439
1.465
1.499
1.515
1.499
1.469
1.433
1.489
1.533
1.541
1.537
1.523
1.499
1.517
1.526
1.495
1.445
1.459
1.458
1.489
1.505
1.477
1.456
1.471
1.509
1.495
1.505
1.489
1.498
1.489
1.509
1.495
1.497
1.477
1.441
1.373
1.279
1.289
1.369
1.341
1.385
1.385
1.263
1.259
1.218
1.000
1.100
1.200
1.300
1.400
1.500
1.600
Jan/12
Feb/12
Mar/12
Apr/12
May/12
Jun/12
Jul/12
Aug/12
Sep/12
Oct/12
Nov/12
Dec/12
Jan/13
Feb/13
Mar/13
Apr/13
May/13
Jun/13
Jul/13
Aug/13
Sep/13
Oct/13
Nov/13
Dec/13
Jan/14
Feb/14
Mar/14
Apr/14
May/14
Jun/14
Jul/14
Aug/14
Sep/14
Oct/14
Nov/14
Dec/14
Jan/15
Feb/15
Mar/15
Apr/15
May/15
Jun/15
Jul/15
Aug/15
Sep/15
Oct/15
Nov/15
Dec/15
prijs LNG
prijsDiesel


