June
2016
HYDROCARBON
ENGINEERING
16
technical regulations governing oil and gas exploration,
particularly shale gas exploration and hydraulic fracturing. A
year later, the Petroleum Agency of South Africa (PASA)
announced that it would begin processing the existing
applications for exploring the Karoo Basin, though it would
not seek or accept additional applications. This timing
corresponded with the Saudi Arabian decision to stop
supporting crude oil prices, and global energy prices have
plummeted since then. Although South Africa has undertaken
energy projects that, at the time, seemed to be uneconomic, it
would be surprising in today’s market to see large scale shale
gas hydraulic fracturing developments go forward. Another
period of high energy prices, however, could spur renewed
interest, given the size of the reserve base and South Africa’s
expertise in Fischer-Tropsch processes.
Oil and other liquids production
South Africa’s upstream sector is organised under the purview
of its national oil company PetroSA. The key commercial oil
and gas fields include Oribi, Oryx and Sable, though these are
mature and largely played out. Oribi and Oryx are currently
not producing, and the Sable field, now known as the E-CE gas
field, is producing natural gas to supplement feedstock for the
Mossel Bay plant, which is PetroSA’s synthetic fuel refinery
(described in more detail in a following section). Slightly to the
east, the F-A gas field produces gas and condensate as feed for
Mossel Bay also.
Figure 3 provides the active oil rig count for South Africa,
as tracked by Baker Hughes. At the height, there were only five
active rigs working in South Africa. In more recent years, there
have been only one or two rigs, or none as production came
on and off. As of January 2016, there was only one active rig in
South Africa. Although over 300 exploration wells have been
drilled in the offshore area, plus 200 onshore, actual
production has almost vanished, and the current regime of
low crude oil prices has stymied additional work. A number of
offshore blocks have been awarded, however, to major
companies including Shell, BHP Billiton, ExxonMobil, Canadian
Natural Resources, Total, Anadarko, Cairn India and ENI.
Although South Africa historically has chafed at the idea of
being subjected to the constraints of the global oil price, it is
very much back in that position.
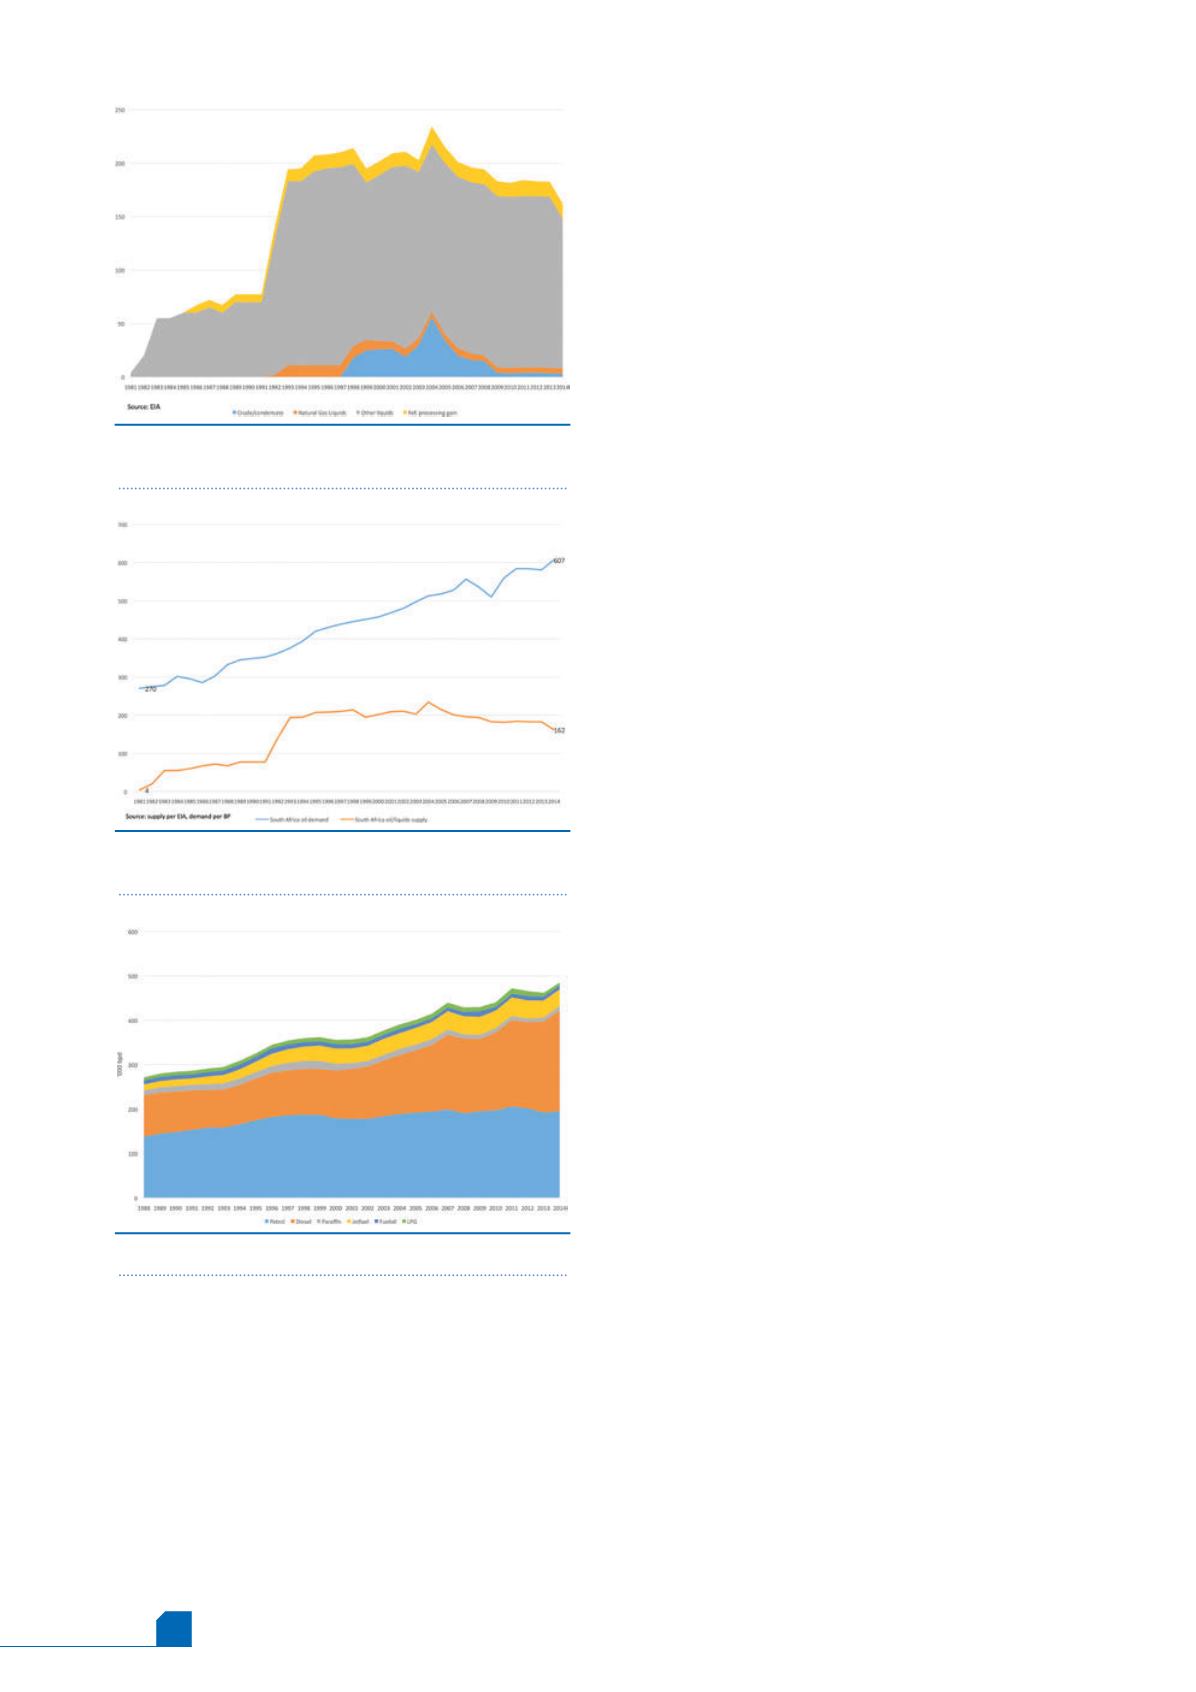
Figure 4 shows the trend in South Africa’s hydrocarbons
liquids production, as compiled by the US EIA. Natural gas
liquids (NGLs) began to be produced in 1991, and production
averaged 11 000 bpd from 1993 - 1998 before tapering down to
5000 bpd from 2008 - 2014. Crude and condensate
production commenced in 1998, averaging 18 000 bpd.
Production gradually ramped up to 54 000 bpd in 2004. But
this was the peak, and production fell to 34 000 bpd in 2005,
20 000 bpd in 2006, and it dwindled to a mere 3000 bpd in
2014.
Transforming coal to gas and liquids
The great majority of South Africa’s liquid hydrocarbon
production comes from its coal to liquids (CTL) and GTL plants.
Sasol is now known around the world as the pioneer of
commercial CTL production. Sasolburg and Secunda were built
atop massive coal deposits. The original CTL complex opened in
1955, long before the world began to have concerns over energy
supply security. The oil price shocks of the 1970s prompted the
construction of Sasol Two in 1980, and its twin Sasol Three in
1983. Sasol Two converts approximately 50 000 tpd of low
grade bituminous coal into a range of chemical and fuel
products. Sasol also added a high purity ethanol plant at
Sasolburg in 1990. In 1995, the first Sasol advanced synthol
reactor came online at Secunda, geared to increasing
production of light hydrocarbons such as olefins and synthetic
gasoline.
As Figure 4 shows, the output from Sasol Two started at
4000 bpd in 1981. It ramped up to 20 000 bpd in 1982. As
Sasol Three was commissioned, CTL output grew to 60 000 bpd
in 1985. Liquids production grew to 77 400 bpd in 1991 with the
completion of the ethanol plant, and another jump in output
was achieved in 1995 with the new synthol reactor.
Figure 5.
South African oil demand versus oil and
liquids supply (000 bpd).
Figure 6.
South African petroleum product demand.
Source:SAPIA
Figure 4.
South African crude and other liquids
production (000 bpd).


