June
2016
HYDROCARBON
ENGINEERING
18
Sasol also made plans for a Sasol Four complex, but they
were shelved. This was envisioned as an 80 000 bpd CTL plant
known as Project Mafutha, to be built in the Limpopo District,
which is in the northeastern part of the country abutting
Botswana and Zimbabwe. The project fell out of favour
because of issues regarding carbon emissions and carbon
capture, and also about scale. At the time, PetroSA was
pursuing a grassroots refinery project known as
Project Mthombo, and the government believed that the
output was better suited to the future demand pattern.
In 1993, South Africa commissioned its GTL plant at
Mossel Bay. It was originally known as Mossref, then Mossgas,
and now is often named PetroSA Mossel Bay. It is located due
north of the offshore Block 9 production area that includes
the E-CE gas fields and F-A gas and condensate fields.
Feedstock arrives via pipeline. It was originally planned as a
25 000 bpd facility, but the design was expanded to
45 000 bpd during construction. Most of the output is
oriented toward synthetic fuel, with a small amount of
chemicals output also.
With the Sasol and Mossel Bay CTL and GTL plants
onstream, the output of these synthetic liquids jumped to
172 000 bpd in 1993 and hit a peak of 185 000 bpd in 1997.
Output since then has been approximately 150 - 160 000 bpd,
with a slight downturn to 140 000 bpd in 2014. In 2014,
South African liquids production included:
n
n
140 000 bpd of CTL and GTL.
n
n
3000 bpd of crude oil.
n
n
5000 bpd of natural gas liquids.
n
n
14 000 bpd of refinery processing gain.
Therefore, unconventional liquids accounted for over 86%
of South Africa’s total liquids supply in 2014. Without
expansion and feedstock, however, output has tailed off. Total
liquid supply peaked at 234 000 bpd in 2004, and it declined
to 162 000 bpd in 2014. As noted, South Africa has a number of
prospective oil and gas basins, and a number of offshore
blocks have been awarded, but the current low oil prices do
not encourage development.
Oil demand and change
The stagnation and gradual decline of liquid hydrocarbon
production has not been matched by a decline in demand.
South Africa is a net importer of oil and oil products, and the
government remains concerned about import dependency
and supply security. Figure 5 compares the trend in
South African liquids supply, as noted by EIA, with
South African demand, as published by BP. In 1981, liquid
production was a mere 4000 bpd, whereas BP reported that
demand was 270 000 bpd. Therefore, the gap between supply
and demand was roughly 266 000 bpd. This level of import
dependence was of great enough concern that it motivated
the government to launch its world scale CTL and GTL
industry. Yet demand kept growing, so that even at the peak
production years in the mid-1990s, the supply gap never got
narrower than 180 - 200 000 bpd. By the year 2002, the supply
gap was 269 000 bpd – essentially back to where it was in
1981, when the government made huge investments to reduce
import dependency. By the year 2014, the gap had widened to
445 000 bpd, leaving the government to ponder once again
about what to do to reduce import dependency.
South African oil demand has not grown at break neck
speed, but it has grown steadily. In many mature economies,
oil demand is expected to begin to decline, as it has done
already in some countries. But South Africa’s energy markets
are not considered to be quite at that point, and the economy
remains energy intensive.
Figure 6 shows the trend in demand for six key products
tracked by the South African Department of Energy, published
by the South African Petroleum Industry Association (SAPIA).
Gasoline and diesel are the key fuels, collectively accounting
for 80 - 87% of the six fuels noted in the figure. The relative
roles of gasoline and diesel have reversed, however. In 1994,
gasoline demand was 165 900 bpd (54% of the total), and
diesel demand was 881 000 bpd (29% of the total). Yet
gasoline demand grew modestly at an average rate of 0.3%/y
from 2004 - 2014. In contrast, diesel demand grew at an
average rate of 5.5%/y from 2004 - 2014. Over the decade,
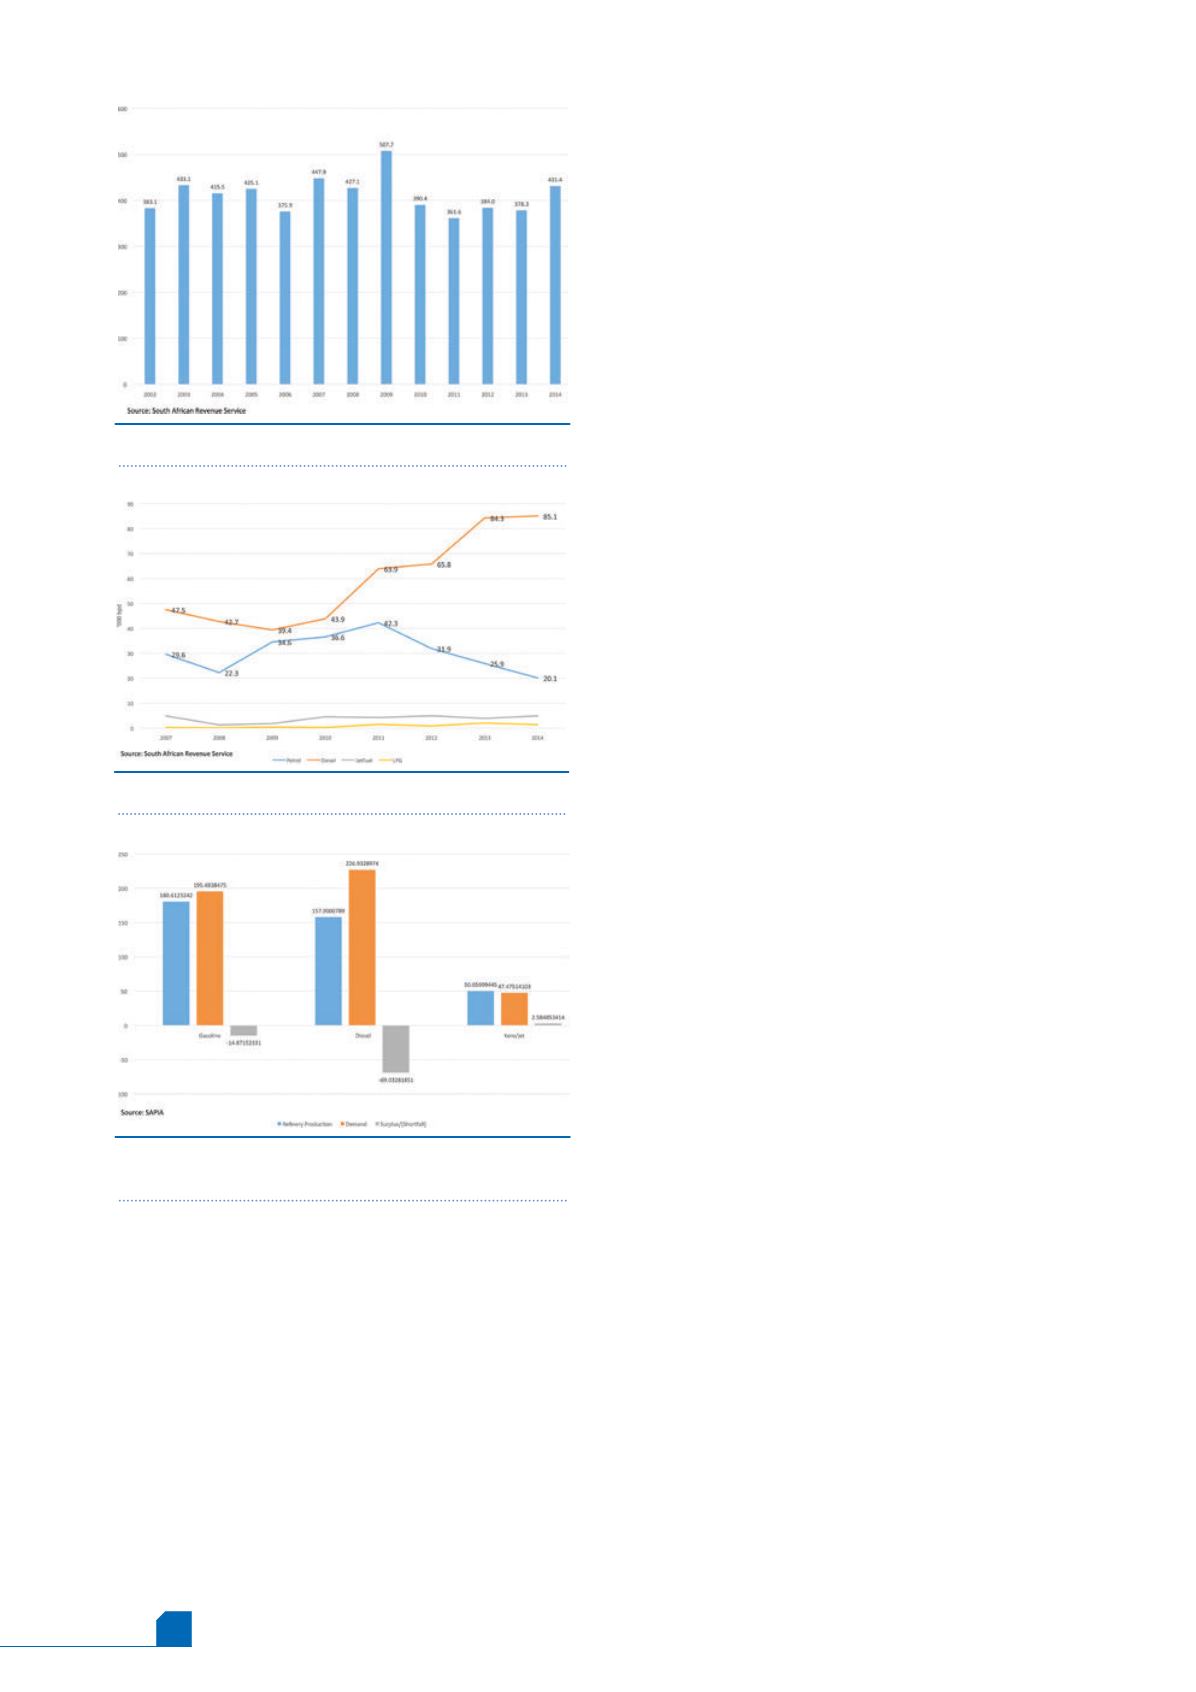
Figure 9.
South African refinery output versus
demand, three key products (2014).
Figure 8.
South African petroleum product imports.
Figure 7.
South African crude imports (000 bpd).


