14 |
Oilfield Technology
May
2016
known as the Central Platform. The depositional history may be
summarised as cycles of highstand carbonate deposits developing
on the shelf margins alternating with lowstand cycles of clastic
sequences thickening into the basin areas.
Numerous source rocks have been identified in this petroleum
system, including the Ordovician, Devonian Woodford, Mississippian
Barnett, Pennsylvanian, Permian Wolfcamp and Bone Springs. The
prospective stratigraphic section exceeds 10 000 ft in the Delaware
Basin, setting up thick stacked pay intervals that are now exploited
with both horizontal and vertical techniques. The most targeted
formations are Wolfcamp, Bone Spring, Avalon and Delaware Sands
and the Spraberry in the Midland Basin. Production varies from oil,
gas, and gas liquids in various zones and parts of the basin, with gas
typically increasing in occurrence at depth.
Observations
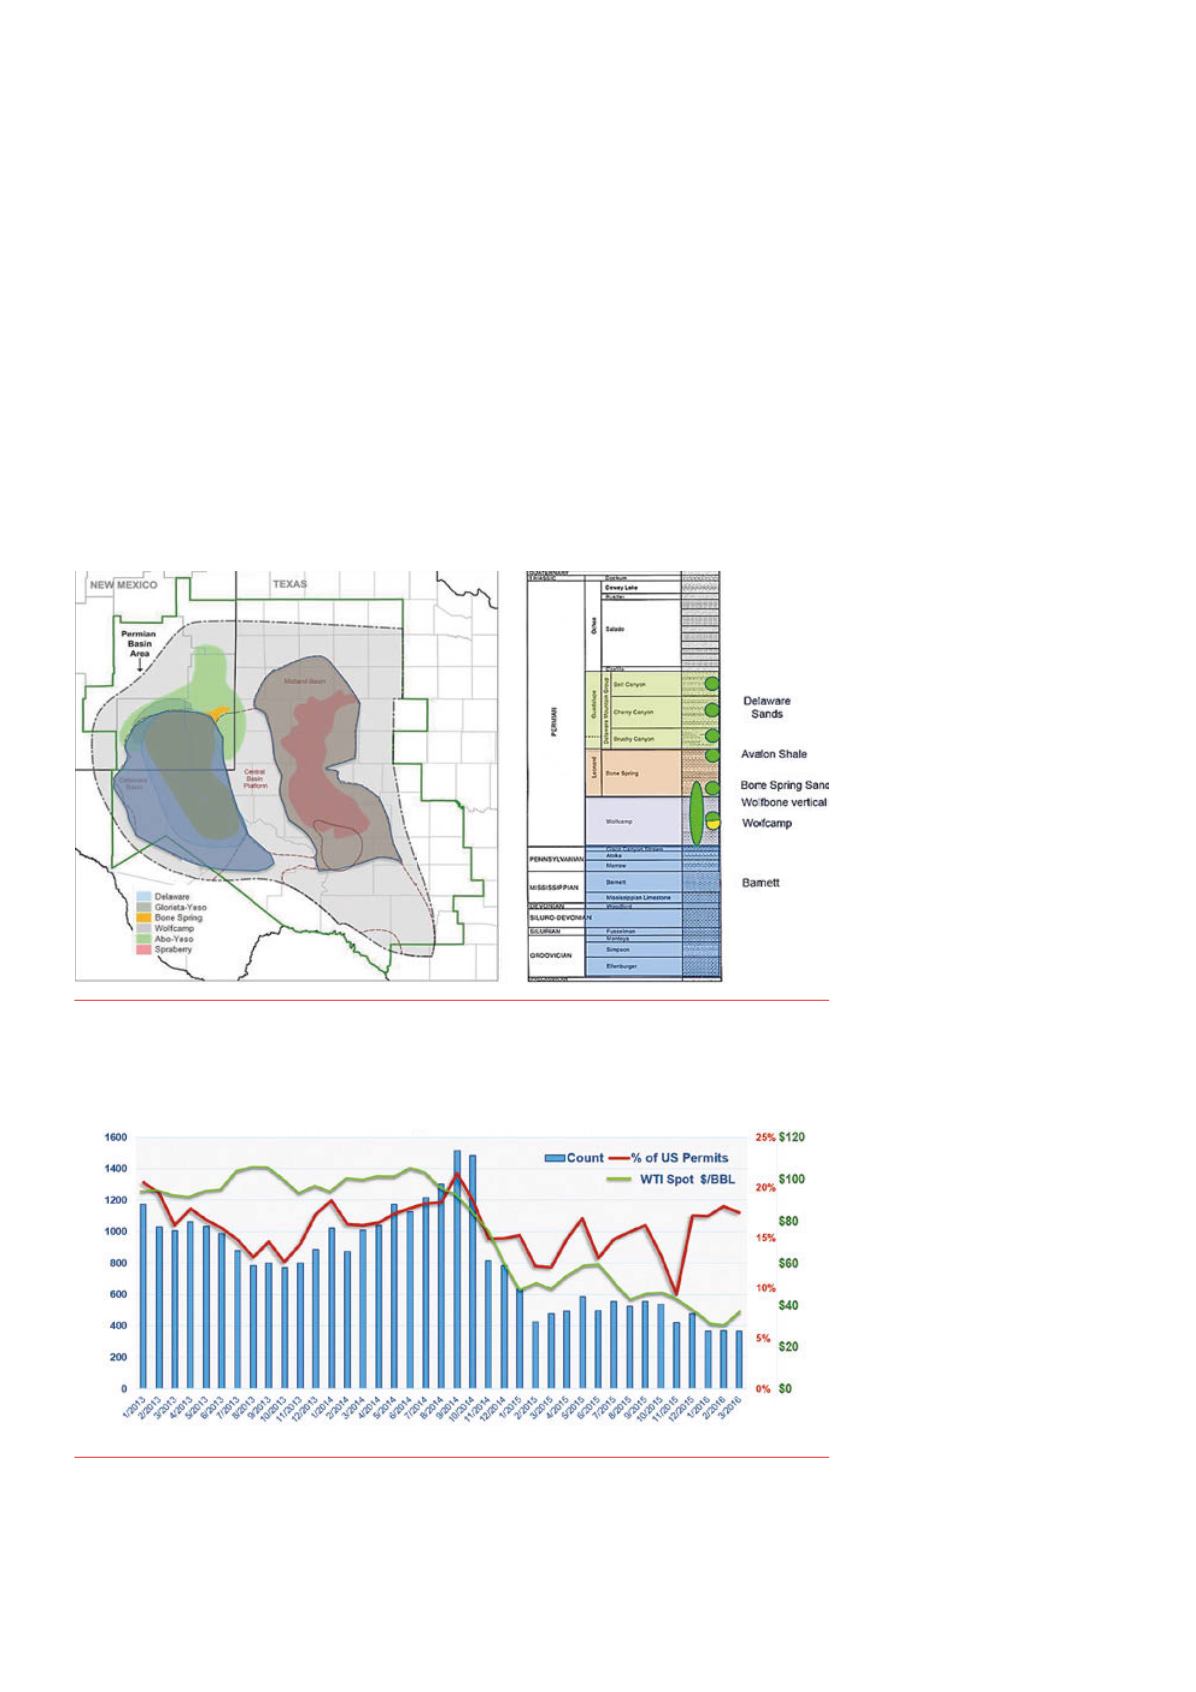
One of the relationships that can be quickly investigated is the impact
on Permian activity relative to other US basins when the price of oil
tumbled. In TGS’s production data interface, Longbow, the company
accessed permit data on a month by month basis. Figure 2 shows the
relationship of new well permits in the Permian relative to the WTI oil
price. This figure also shows Permian basin permits as a percentage
of all the US drilling permits issued.
Note both the decline in Permian permitting and the decline
in percentage of total US permitting throughout most of 2013 in
contrast to the high and increasing oil prices. With nine months
of fairly stable high prices in 2014, permitting trends upward. After
this resurgence in 2014 with a peaking of both permit count and
percentage of US total permits, followed by the steep decline in price,
remarkably, the Permian shows an upward trend in relative US permit
percentage as oil prices decline.
An anomaly can also be noted in the number of all US well
permits approved in October and November 2015. This occurred
in the state of California as operators filed an abnormal number of
permits because regulatory changes were going into effect thereafter,
which made permitting more expensive and drilling regulations more
stringent.
Figure 3 shows the map distribution of approved well permits
starting 2013 and ending March 2016.
The light blue well spots are 2013
and 2014 locations, approved
before the oil price collapse, and
the dark colours are permits issued
in 2015 and 2016. As can be seen
there is little change in the trend
or clustering of the locations of
the permits. Other than a few new
locations testing the shelf areas
and prospectivity to the southwest
in the Delaware basin, the majority
of wells are permitted in the core
of the producing areas. Where
other trends such as the Utica and
Scoop & Stack may still be expanding
geographically, Permian operators
are able to focus on sweet spots in
the multiple stacked pay areas.
Some of the more interesting
relationships are found when
working with recent production
data. In the example in Figure 4 TGS
accessed the reported measured
depth for all wells, (vertical,
directional or horizontal) and looked
at relationships of initial production
with the total drilled footage of
wells that came on production
over the 23 months before the oil
price collapse and 13 months after.
The longer the sample rate for
production the better, but because it
has a little more than a year of data
after the price collapse, the company
chose to use the initial three months
cumulative allocated production
value as a sample interval to
determine well performance.
Figure 4 plots the major component
oil from Texas production data, from
1 January, 2013 plotted against
average footage drilled per well
Figure 1.
PermianBasin (modified fromEIA) shadedarea illustrating theDelawareBasin inblue andMidland
Basin in grey and red. A number of prospective formations and zones are highlighted. Generalised stratigraphic
column showing commonprospective zone.
Figure 2.
Number of approvedPermianwell permits permonth from2013 through 2015 are shown on the blue
bars. The red curve shows percentage of Permianpermits to total US permits. The green curve is the spot price
of West Texas Intermediate as reportedby the EIA. Note the general increase inpercentage of Permianpermits
to total US permits as the oil price continues to sag fromJanuary 2015 to February 2016. The anomaly in%of
US permits inNovember 2015 is due to an increase inCaliforniapermits in response to regulatory changes.


