22 |
Oilfield Technology
May
2016
in order to visualise the modifications of the velocity field where
expected.
Following a mistie tomographic update, the velocity model
recovers the shallow velocity anomalies in the shallow part and
removes the pull-down and pull-up in the deeper parts.
Salt intrusions
The next example is of a salt intrusion not being taken into account.
Typically, after deriving the sediment velocity, the top of salt is
picked, and a constant velocity will be associated with the salt.
Then base of the salt is picked, with velocity intrusions in the salt
still being ignored at this stage. Sometimes the geometry of the
salt intrusions is not clearly seen, making them hard to interpret.
However, if the velocity of the salt intrusion is not considered in the
velocity model, it will lead to severe distortions in the bottom of the
salt and the structure underneath the salt. Figure 5 left shows an
example of a velocity having a salt body with a sediment intrusion.
This velocity was used for forward modelling to create synthetic
gathers using a two-way wave equation algorithm. A typical salt
modeling workflow was carried out, starting from a sediment
velocity used for migration (Figure 5 centre), top of salt was picked,
and then salt velocity was flooded, ignoring the intrusion (Figure 5
right), even though in this synthetic case the intrusion is clearly
seen.
As a result of not accounting for salt intrusions, the seismic
image below the salt will be distorted; the shape of the salt body
will not be accurate. Figure 6 shows the result of the migrated
image with the salt flooded velocity which does not account for
the intrusions. Distortions (pull down) below the salt are visible, as
is the shape of the salt.
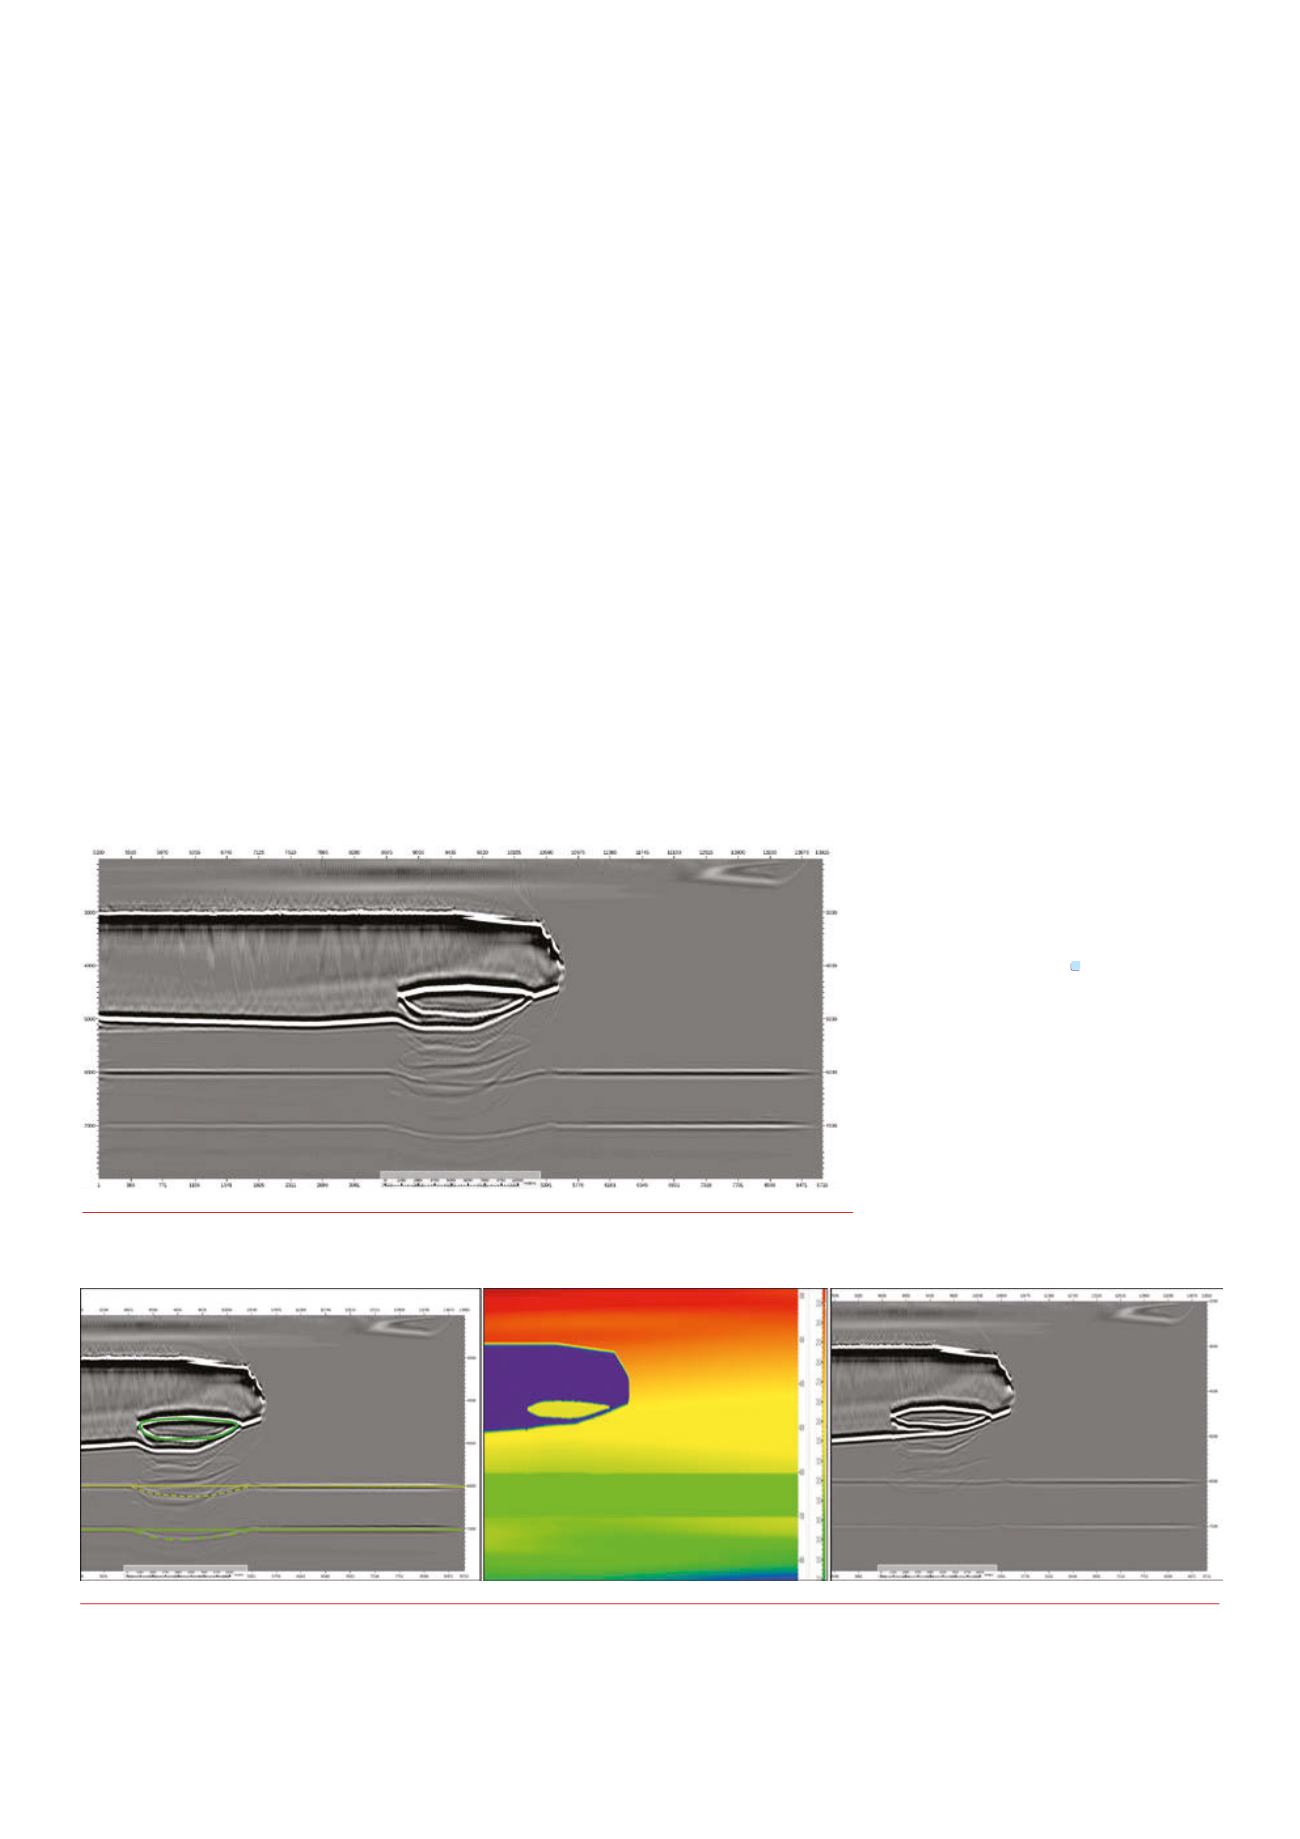
As in the previous example, the goal is to pick the current
interpretation beneath the salt body, and the expected
interpretation. On the left of Figure 7, the dashed line shows the
interpretation of the current model, solid lines represent the
expected interpretation. Misties are calculated by subtracting the
current interpretation from the expected depth position of the
event. Those misties are used to feed the tomography. The next
stage is to interpret the geobody that represents the sediment
intrusion within the salt, to only update the velocity field inside the
salt intrusion. On real data, the challenge is certainly associated
with the interpretation or delineation of the geobodies representing
the intrusions. Figure 7 (centre) shows the velocity model following
the tomography workflow, which has updated the velocity model
inside the intrusion and has correctly adjusted the shape of the
bottom of salt. Figure 7 (right) shows the final migrated image with
the updated velocity model from tomography.
Summary
This article presents an approach to refining the velocity model from
an interpretative point of view, by envisioning the geology derived
from the final velocity mode. Ideally, a velocity will be derived that
model that generates flat gathers, reasonable and acceptable depth
position, and geometry of the seismic events. However, occasionally
the final model generates questionable geologies that point to a
possible error in the velocity model. The approach described above
can be used to correct such distortions and amend the velocity
model. Velocity analysis based on reflection
information is quite limited for some
complex geological scenarios. This article
shows that the mistie tomography approach
can be used a as complementary tool to
refine the velocity model.
References
1. Jones, I., ‘Tutorial: Incorporating near-surface
velocity anomalies in pre-stack depth migration
models’,
First Break,
Vol, (30 March, 2012),
pp. 47 - 58.
2. Liram L., Naveh Y., Dekel G., Koren Z., 2014 SEG
Annual Meeting, ‘Time preserving tomography’,
(2014).
3. Kosloff D., Zackhem U., Koren Z., ‘Subsurface
velocity determination by grid tomography of
depth migrated gathers’, SEG Technical Program
Expanded Abstracts (1997), pp. 1815 - 1818.
Figure 6.
Distortion of the image belowsalt body.
Figure 7.
Result ofmigrated imagewith salt flooded velocity, dash lines represent the current interpretation, solid lines are the expected interpretation.
The intrusionwas picked to update the velocity field only inside the salt intrusion (left). Updated velocity result ofmistie tomography (Centre). Migrated
depth image following the velocity update (Right).


