16 |
Oilfield Technology
May
2016
for all wells that came on stream over that time
period.
For clarity in this published format, the
data here is displayed in quarters rather than
months. What is rather remarkable is the clear,
continuous improvement in the initial 90 day
production rates for the footage drilled. It is
also apparent that the average footage drilled
per well has not risen or varied significantly
over the three years sampled. A slight increase
can be seen in 2012 but to the end of 2015 the
overall average footage remains quite similar.
Horizontal to vertical ratios continue to increase
slightly as observed in other articles. It should
be noted that with large data sets such as this,
the overall trend may vary in more specific areas
but nevertheless this is a compelling trend.
This display indicates that the operators in the
Permian as a whole have been very successful
in improving the efficiency of their drilling and
completion programmes.
Comparing this data to other basins
requires some caution because the Permian is
a multi-zone basin and complexities on drilling
and completions may be greater than in single
zone trends such as the Eagleford. Not to deny
the complexities of the Eagleford but a better
comparison may be with another multizone
play such as the Scoop & Stack in the east
Anadarko Basin. The Scoop & Stack continues
to present a significant learning curve and it can
be argued that this trend is not as far along on
the exploitation cycle; not only are the number
of stacked pay zones continuing to increase, the
trend continues to expand laterally.
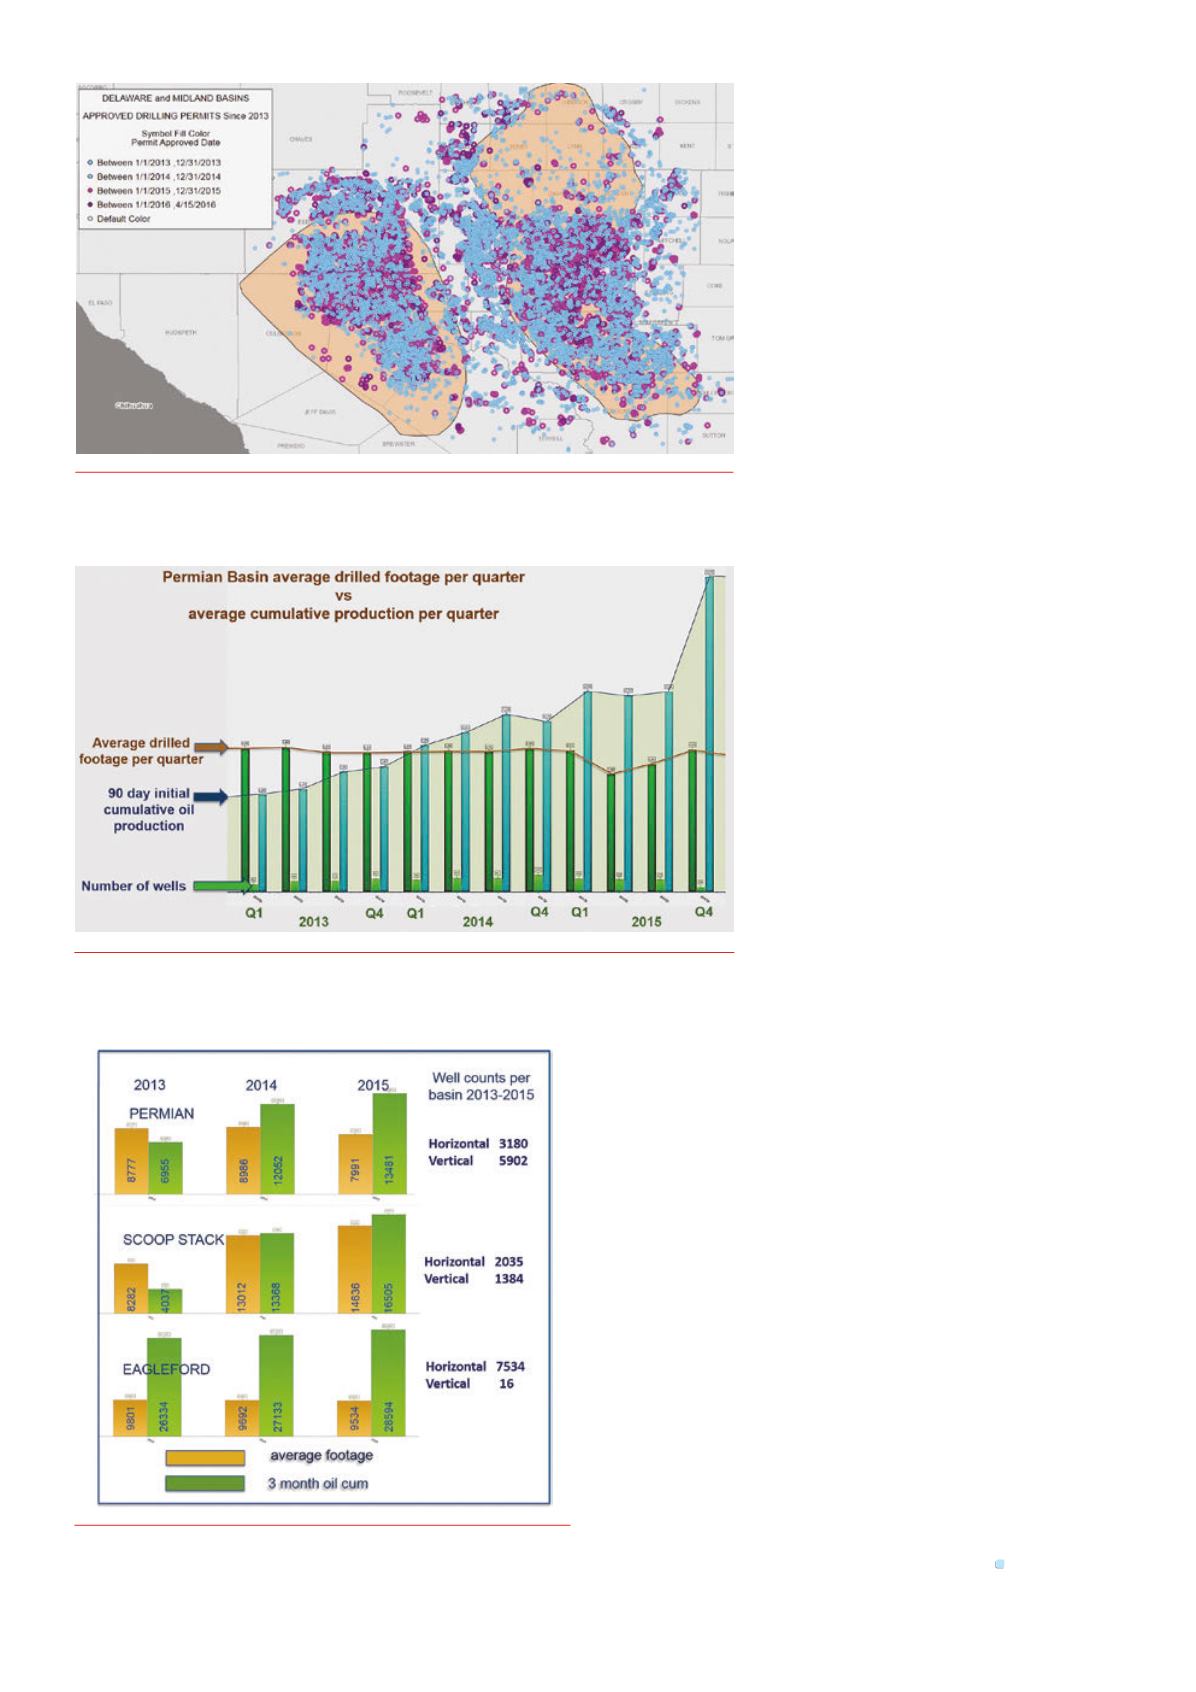
In Figure 5, a comparison can be observed
between the initial 90 day cumulative oil values
for wells coming on production with average
drilled footage for the Permian, Scoop & Stack,
and Eagleford. The Eagleford is fairly stable, the
Scoop & Stack shows some improvement (even with increasing
footage), and the Permian shows consistent production gains with
decreasing drilled footage. The chart also lists the number of vertical
and horizontal wells drilled in each basin area from 2013 through
2015.
Summary
The Permian with its vast reserves, rich production history, and
huge volumes of available data continues to provide an excellent
proving ground for oilfield technologies and data analytics. The
industry continues to see rewards for innovation in this basin, and
well performance results benefit from the ability of operators and
investors to access and establish graphical and spatial relationships
in the data. Through desktop and web-based analytical tools
this approach continues to become more accessible. As industry
continues to consume larger and more comprehensive volumes
of data, providers such as TGS continue to develop more robust
methods to compile and deliver reliable data through traditional,
cloud, and maps services. Challenges remain in providing consistent
data sets when working with varying formats across multiple state
agencies, and efforts continue to explore ways to standardise and
improve confidence in analysis and interpretations.
Figure 3.
PermianBasinarea showingDelaware andMidlandBasins in tan. Blue locations are
approveddrillingpermits between January 2013 andDecember 2014. Pink andpurple locations
are approveddrillingpermits between January 2015 and April 2016.
Figure 4.
PermianBasinaverage drilled footage plottedwith initial threemonth cumulative
production. The average footage is consistent to slightly decreasing over the three years shown
whereas improvement inproduction is quite dramatic.
Figure 5.
Comparison of Permian, Scoop&Stack and Eagleford initial
threemonth production versus footage drilled.


