June
2016
HYDROCARBON
ENGINEERING
36
operation, optimising flare operation from both a cost and
CE/DRE perspective. Automatic adjustments to fuel or assist
gas, steam and air can be made via the closed loop control
system, based on real time conditions of the flare system,
lowering costs for supplemental fuel and providing more
accurate maintenance of required DRE.
Benefits of the FlareSentry include:
n
n
Elimination of inaccuracies associated with the current
practice of monitoring indirect parameters (heating value,
velocity, etc.) versus direct monitoring of CE.
n
n
Autonomous operation eliminates ‘aiming’ or manual data
reduction.
n
n
Providing SI assists the operator with achieving incipient
smoke conditions day and night.
n
n
Continuous data availability provides real time CE and SI to
operators for optimal flare performance.
n
n
Non-contact monitoring minimises operating and
maintenance (O&M) cost, which is high for indirect
monitoring methods because the sensors for these
methods are in direct contact with the flare vent gases.
n
n
A short measurement cycle (milliseconds, averaged over
seconds to one minute) enables quick response and
minimises cost for supplemental fuel.
n
n
An industrial interface allows for closed loop flare
operations based on direct CE and SI values.
n
n
Providing CE values along with SI and pilot status gives the
operator a complete picture of flare performance with a
high level of confidence.
n
n
Simplified monitoring, reporting and compliance activities.
Conclusion
Regulations related to flare operations continue to tighten, but
employing the best available technology, such as FlareSentry, to
monitor and control the actual CE of a flare system in real time
gives operators the necessary tool to meet the challenge.
Bibliography
1.
COBURN, J., RTI International Memorandum on Flare Control
Option Impacts for Final Refinery Sector Rule, 2015,
EPA-HQ-OAR-2010-0682-0748.pdf.
2.
US Environmental Protection Agency, Parameters for properly
designed and operated flares, 2012, EPA Office of Air Quality
Planning and Standards (OAQPS):
. epa.gov/ttn/atw/
flare/2012flaretechreport.pdf (accessed 24 March 2015).
3.
US Environmental Protection Agency, Fact sheet, Proposed
petroleum refinery sector risk and technology review and new
source performance standards, 2014:
/
petrefine/20140515factsheet.pdf (accessed 24 March 2015).
4.
ZENG, Y., MORRIS, J., and DOMBROWSKI, M., Validation of a newmethod
for measuring and continuously monitoring the efficiency of industrial
flares, Journal of the Air &Waste Management Association, 2016, 66:1,
pp. 76 - 86, DOI: 10.1080/10962247.2015.1114045.
5.
ZENG, Y., MORRIS, J., and DOMBROWSKI, M., 'Multi-spectral infrared
imaging system for flare combustion efficiency monitoring,' US Patent
9,258,495, 2012. Issued on 9 February 2016.
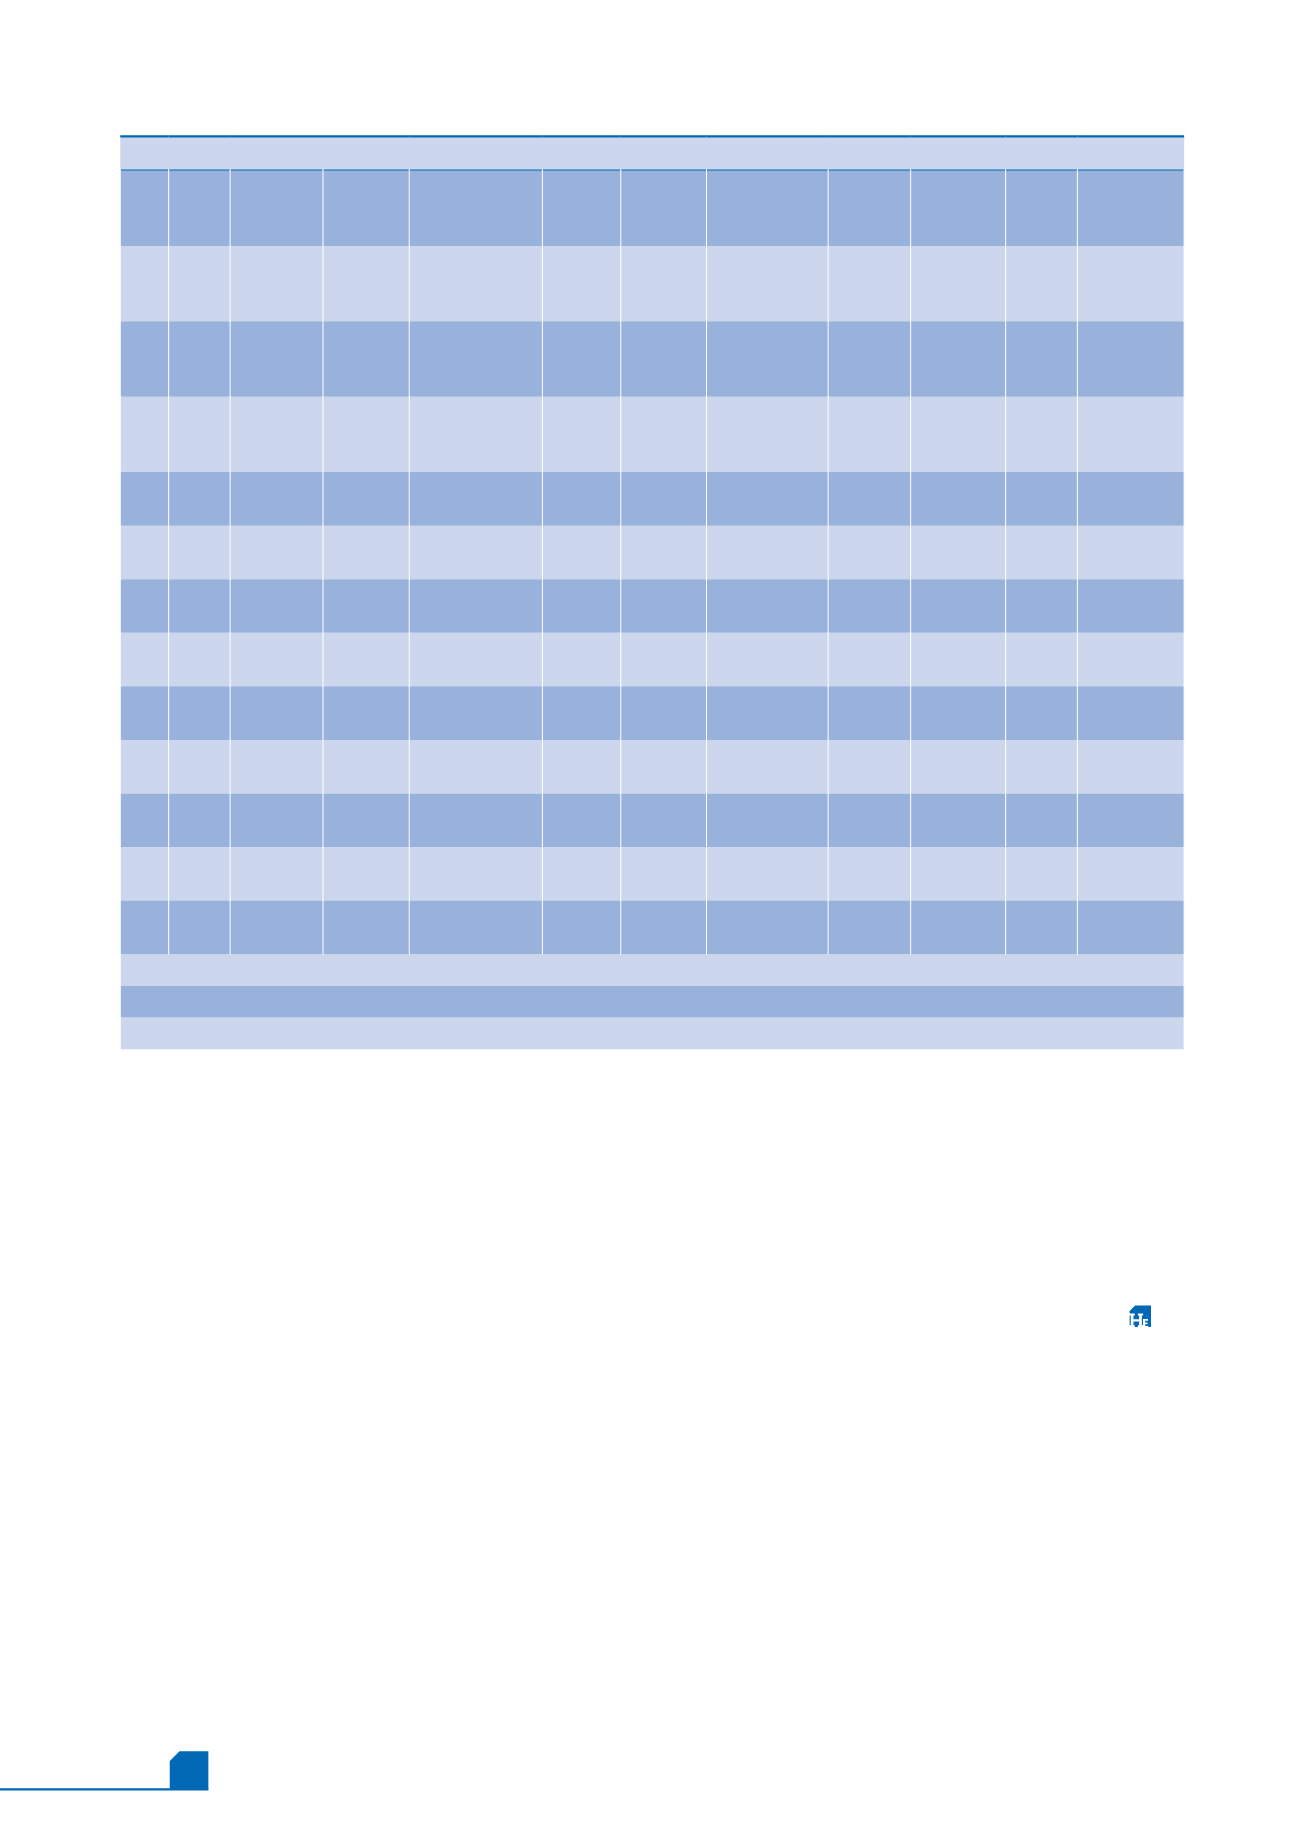
Table 1 continued.
Flare CE validation test results
Test
no.
Flare
type
Fuel
Fuel
flow rate
(lb/hr)
Stoichiometric
air
Steam/
HC
(lb/lb)
CZNHV
(Btu/ft
3
)
CE-extractive
method
CE-new
method
CE
difference
Smoke
index
Avg. O
2
in extracted
sample
26 MPGF Propane/
N
2
(50/50)
2448
99.99%
99.80% -0.19% 0.35
18.19%
27 MPGF Natural
gas
(100%)
3300
100.00% 99.80% -0.20% 0.26 17.03%
28 MPGF Natural
gas
(100%)
3300
100.00% 99.90% -0.10% 0.32 15.76%
29 QFS Propane
(100%)
4640
0.52
1035
99.99%
98.70% -1.29% 0.56 19.91%
30 QFS Propane
(100%)
4640
0.52
1035
99.97%
99.10% -0.87% 0.70 17.60%
31
QFS Propane
(100%)
1879
1.25
571
97.75%
97.50% -0.25% 0.46 19.90%
32 QFS Propane
(100%)
1879
1.25
571
67.48%
77.20% 9.72% 0.83
20.24%
34 QFS Propane
(100%)
1537
1.53
489
59.99%
73.60% 13.61% 0.17
19.94%
36 QFS Propane
(100%)
1537
1.53
489
70.57%
76.60% 6.03% 0.15
18.75%
37 QFS Propane
(100%)
1537
1.53
489
83.15%
85.10% 1.95% 0.21
18.38%
38 QFS Propane
(100%)
3328
0.71
850
99.67%
99.10% -0.57% 0.40 17.38%
39 QFS Propane
(100%)
3328
0.71
850
99.82%
99.40% -0.42% 0.46 18.86%
Average CE difference between the two methods – all 28 tests: 0.50%
Number of tests with oxygen <19.5% (indication for good extraction): 18
Average CE difference between the two methods – 18 tests with oxygen <19.5%: -0.10%


