June
2016
HYDROCARBON
ENGINEERING
34
When post combustion gases can be accurately measured,
flare CE is typically determined by the following equation,
where CE (%) is the combustion efficiency, expressed as a
percentage.
n
n
Equation one:
Where: CO
2
= the volume concentration of CO
2
in the
plume once combustion has ceased; CO = the volume
concentration of carbon monoxide (CO) in the plume once
combustion has ceased; HCi = the volume concentration of the
i
th hydrocarbon (HC) compound remaining in the plume once
combustion has ceased; n
i
= the number of carbon atoms in the
Figure 1.
FlareSentry™ unit.
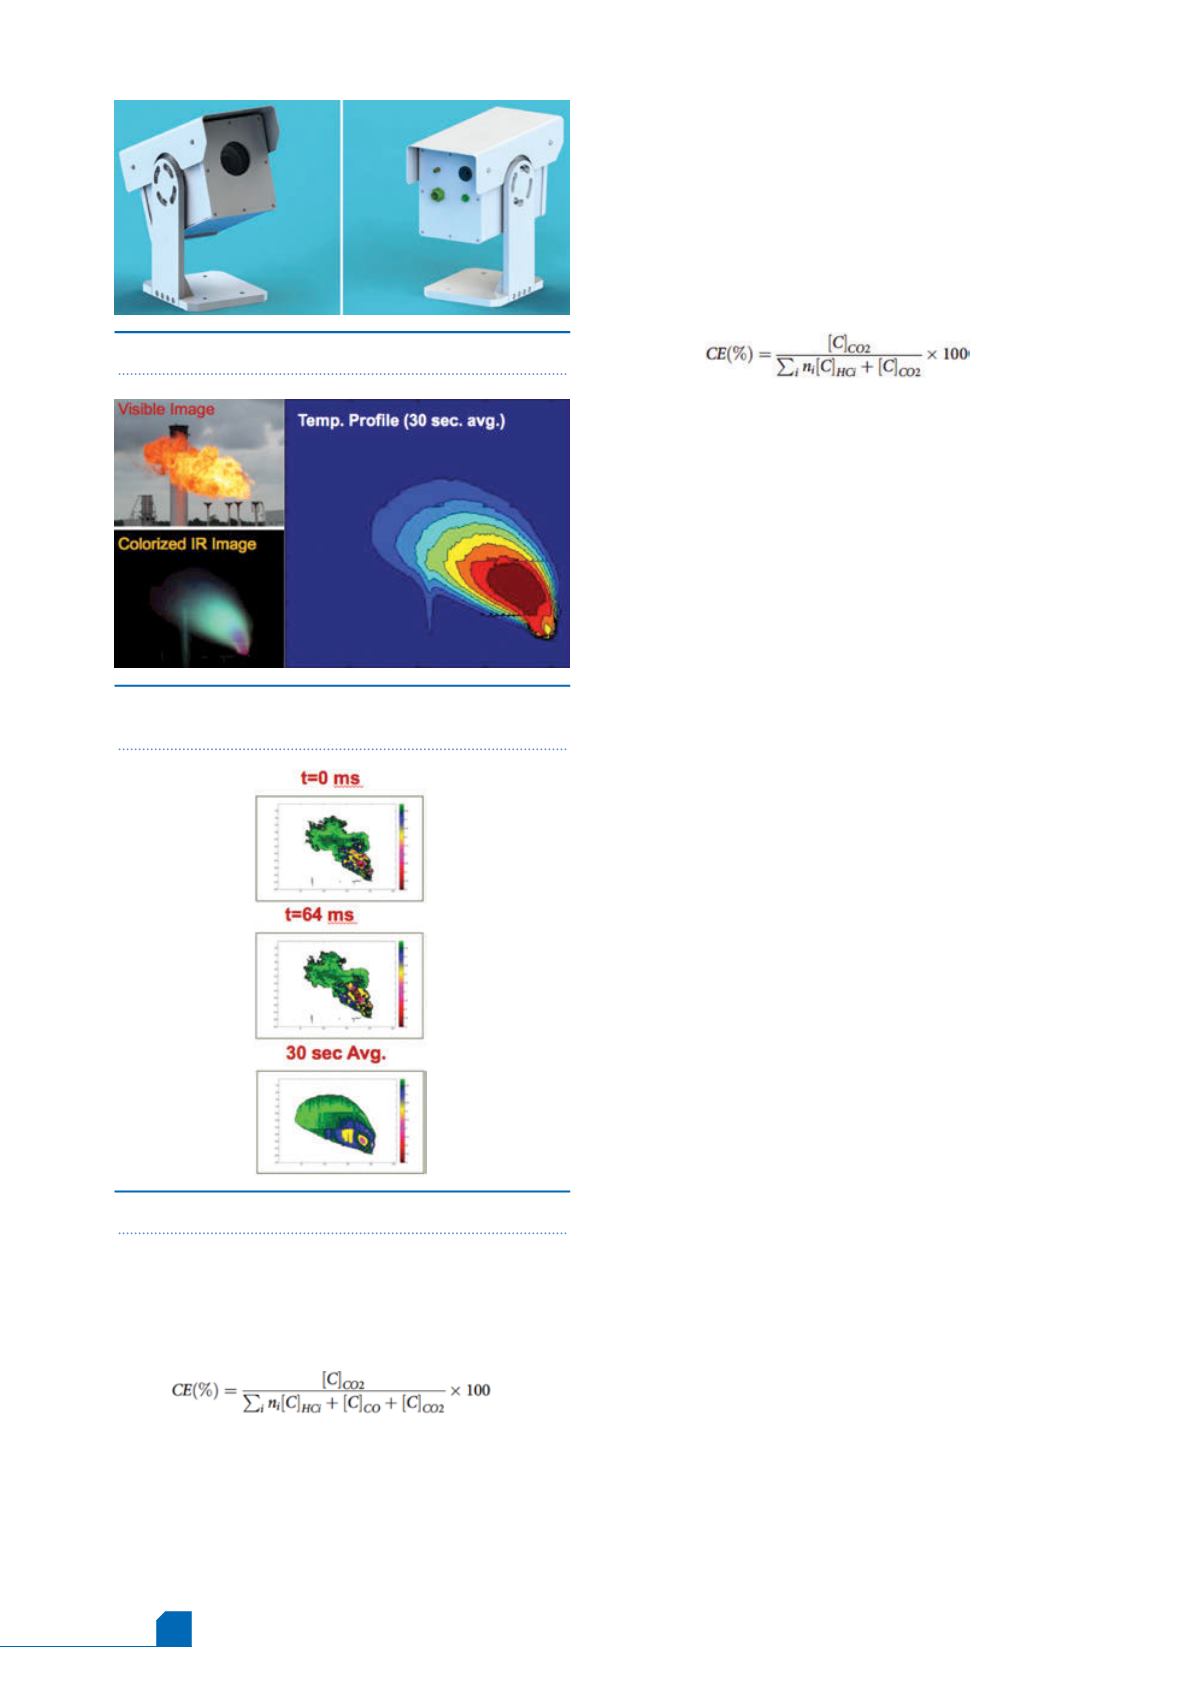
Figure 2.
Comparison of visible, infrared and
averaged profile images.
Figure 3.
Comparison of pixel images over time.
i
th HC compound; and i = the
i
th hydrocarbon compound in the
flare vent gas. When there is only one compound,
i
= 1.
When there is no unburned HC (HC
i
= 0) and no product of
incomplete combustion, such as CO in the plume (CO = 0), the
combustion is complete and CE is 100%. Under most common
conditions, the concentration of CO as a product of incomplete
combustion is measured in orders of magnitude lower than either
CO
2
or HC. For this reason, CO can be neglected in the CE
calculation. Therefore, equation one becomes equation two.
n
n
Equation two:
EPA rulings dictate the required DRE for flare systems, but, as
shown in equations one and two, flare performance (as
determined by destruction of HC) can be measured by CE. As
equation two directly compares unburned HC and its ultimate
combustion product (CO
2
), the CE calculated by equation two
can also be used as an approximation of DRE for HC – that is, how
much HC is destroyed regardless of howmuch is in the CO stage.
The known shortcomings of current indirect monitoring
methods, in combination with the new EPA standards and
deadlines, drove the development of a new flare CE
measurement and monitoring method – a technology that can be
used to directly, autonomously and continuously monitor flare
performance in real time.
The new method for flare CE measurement and monitoring
was first proposed by Zeng, et al., in 2012 and has been proven
through a series of large scale validation tests. It is based on a
unique multi-spectral infrared (IR) imager that provides a high
frame rate, high spectral selectivity and high spatial resolution
(Figure 1).
The method can be deployed for short term flare studies or
for permanent installation providing real time continuous flare CE
monitoring. In addition to the measurement of CE, the method
also measures and reports the level of smoke in the flare flame,
regardless of whether it is day time or night time. The
measurements of both CE and smoke levels provide the flare
operator with a real time tool to identify and operate at the
‘incipient smoking point’ to optimise flare performance.
The multi-spectral IR imager simultaneously measures the
relative concentrations of combustion products, CO
2
and
unburned HC at the pixel level. The relative concentrations of
CO
2
and HC levels measured at each pixel are used to calculate
the CE for that pixel, which represents a path-averaged CE for a
column of combustion gases represented by the pixel. A CE
value for the overall flare, at any given moment, is calculated by
averaging the CE values of the pixels that represent the outer
layer of the combustion zone of the flare where combustion has
ceased.
A CE value representing the flare at any given moment is
calculated by averaging CE values of the pixels that represent
the outer layer of the combustion zone of the flare. The imager
has a high frame rate (11 - 30 frames/sec.) that results in a data
acquisition cycle of 91 - 33 ms. The short data acquisition cycle
means that the path length through the plume depth can be
considered constant for each measurement (frame). This
addresses the significant limitation of other imaging-based
technologies with long data acquisition cycles (e.g., 1 sec.
[Figure 3]). As the data acquisition cycle increases, the
uncertainty due to the changing conditions (plume depth)
increases and the accuracy of the result will suffer. This new
method has been developed into the FlareSentry
TM
,
multi-spectral infrared (IR) imager – the first practical,
autonomous, real time monitoring device for flare CE.


