68 |
Oilfield Technology
May
2016
handwritten digits, improving correct digit classification from92% in 1998
to over 99.75% correct in 2012, surpassing human performance.
Asmartapproach
Modern machine learning techniques provide powerful tools for
automated control and warning systems. Pason has partnered with
CoVar Applied Technologies to develop a system that uses machine
learning to analyse drilling data and generate much smarter predictions
of normal mud behaviour. This will help ePVT users with early detection
of kicks, losses and spills.
Mud volume and flow rates fluctuatewhen rig crews carry out standard
tasks, such asworking pipe up and down, transferringmud between tanks,
or when a connection is beingmade. Traditional alarms
trigger whenever they detect a pre-defined variance inmud
volumes and flow rates. Since these vary somuch, alarms
are a frequent sound on the rig.
The adaptive alarms tool operates differently. Using
machine learning techniques, this new system is able to
estimate what themud volumes and flow rates should
be given the rig’s current operations. With the event
detection upgrade, ePVT will only generate alarms when
it detects changes that are not expected. That means
drillers will have far fewer alarms to cope with every shift.
An analysis of 12 holes drilled by 12 different rigs showed
the standard alarmmethod generated an average of 14
false alarms an hour, while the adaptive alarmgenerated
an average of one false alarmevery 20 hours, for a 99%
reduction in false alarms.
Howdoes ePVT come upwith the volume and flow
estimates? It uses thewealth of data provided by the
Electronic Drilling Recorder (EDR). The systemuses sensors
to track pump rate (SPM), time and rates of change, block
position, mud levels in every tank, and the flowout of well.
Unlike other kick detection systems, ePVT uses an array
of standard sensors already found onmost rigs. This is
less expensive thanmanned services. With the algorithms
provided by CoVar, sensors such as a flowpaddle provide
all the data necessary to run effective event detection.
This standard data from the EDR system is used as
input for machine learning algorithms that generate
expected flow rates and tank volumes in real time. Alarms
only activate when themeasured values differ from these
expected values. Drillers can see graphs showing exactly
how themeasured and expected values differ.
This is especially useful during periods such as
connections, whenmud volumes fluctuate and flow is
expected to drop to zero. In standard systems, rig crews
tend to ignore the alarms that routinely go off during
connections. From circulating tomaking connections, the ePVT system
analyses mud volume and flow to give advanced warning of kicks and
losses. The first few times the crewmakes a connection, the event
detection system records the flowback data during the connection
and comes up with a profile for that hole. In subsequent connections,
the alarms only activate if the flowback data differs substantially from
the range of values captured in the profile. With this method, kicks and
losses can be identifiedmuch earlier.
Having the data is one thing. It is just as important to provide that
data to drillers in a way that is easy for them to understand and use
at a glance. That is why the company has continued to enhance the
ePVT interface tomeet the needs of users. The interface can be pulled
up at the touch of a screen and shared across the rig site and can also
be used to create digital trip sheets. Where drillers have traditionally
needed to fill in trip sheets by hand every time they trip out of the hole,
they can now record trips using ePVT, which automatically captures
trip information in a simple interface. This makes the task quicker to
complete, and provides the information immediately to anyone else
following the well’s progress. It is all designed to keep the driller focused
on what he needs to watch, andminimise any distracting information.
RIG INFO
TREND GRAPH
TRIP REPORT
TRIP INFO
TRIP TOTAL
Start Time
End Time
Total Hours
Reason for Trip
Name
Signature
Date
Calculated
Measured
Difference
Well Name
Date
Operator
Rig Number
Contractor Name
Company Drilling
Bakken Shale 14-2H1
McBride Resources
Company Drilling 57
Feb 10, 2016 17:56
Feb 10, 2016 17:56
Feb 11, 2016 16:59
Replace Bit
23.05
Mark Driller
Feb 11, 2016 16:59
70.90 barrels
79.28 barrels
8.38 barrels
TRIP RECORD
Component
Number
of
Dry/Wet
Calculated Volume
Measured Volume
Difference
Individual
Volume
Cumulative
Volume
Fill Volume Cumulative Volume
Stands
barrels
barrels
barrels
barrels
barrels
Drill Pipe
5
DRY
3.90
3.90
1.88
1.88
-2.02
Drill Pipe
10
DRY
3.90
7.80
5.87
7.76
-0.04
Drill Pipe
15
DRY
3.90
11.70
5.23
13.10
1.40
Drill Pipe
20
DRY
3.90
15.60
5.68
18.78
3.18
Drill Pipe
25
DRY
3.90
19.50
3.84
22.70
3.20
Drill Pipe
30
DRY
3.90
23.40
3.84
26.54
3.14
Drill Pipe
35
DRY
3.90
27.30
9.53
36.07
8.77
Drill Pipe
40
DRY
3.90
31.20
4.14
40.28
9.08
Drill Pipe
45
DRY
3.90
35.10
3.54
43.82
8.72
Drill Pipe
50
DRY
3.90
39.00
5.42
49.50
10.50
Drill Pipe
55
DRY
3.90
42.90
3.84
53.34
10.44
Drill Pipe
60
DRY
3.90
46.80
3.24
56.62
9.82
Drill Pipe
65
DRY
3.90
50.70
3.53
60.16
9.46
Drill Pipe
70
DRY
3.90
54.60
6.66
67.16
12.56
Drill Pipe
75
DRY
3.90
58.50
0.94
68.10
9.60
Drill Pipe
80
DRY
3.90
62.40
5.46
73.56
11.16
Heavy Weight
81
DRY
1.70
64.10
0.94
74.50
10.40
Heavy Weight
82
DRY
1.70
65.80
0.97
75.48
9.68
Heavy Weight
83
DRY
1.70
67.50
0.91
76.72
9.22
Heavy Weight
84
DRY
1.70
69.20
0.97
77.70
8.49
Heavy Weight
85
DRY
1.70
70.90
1.59
79.28
8.38
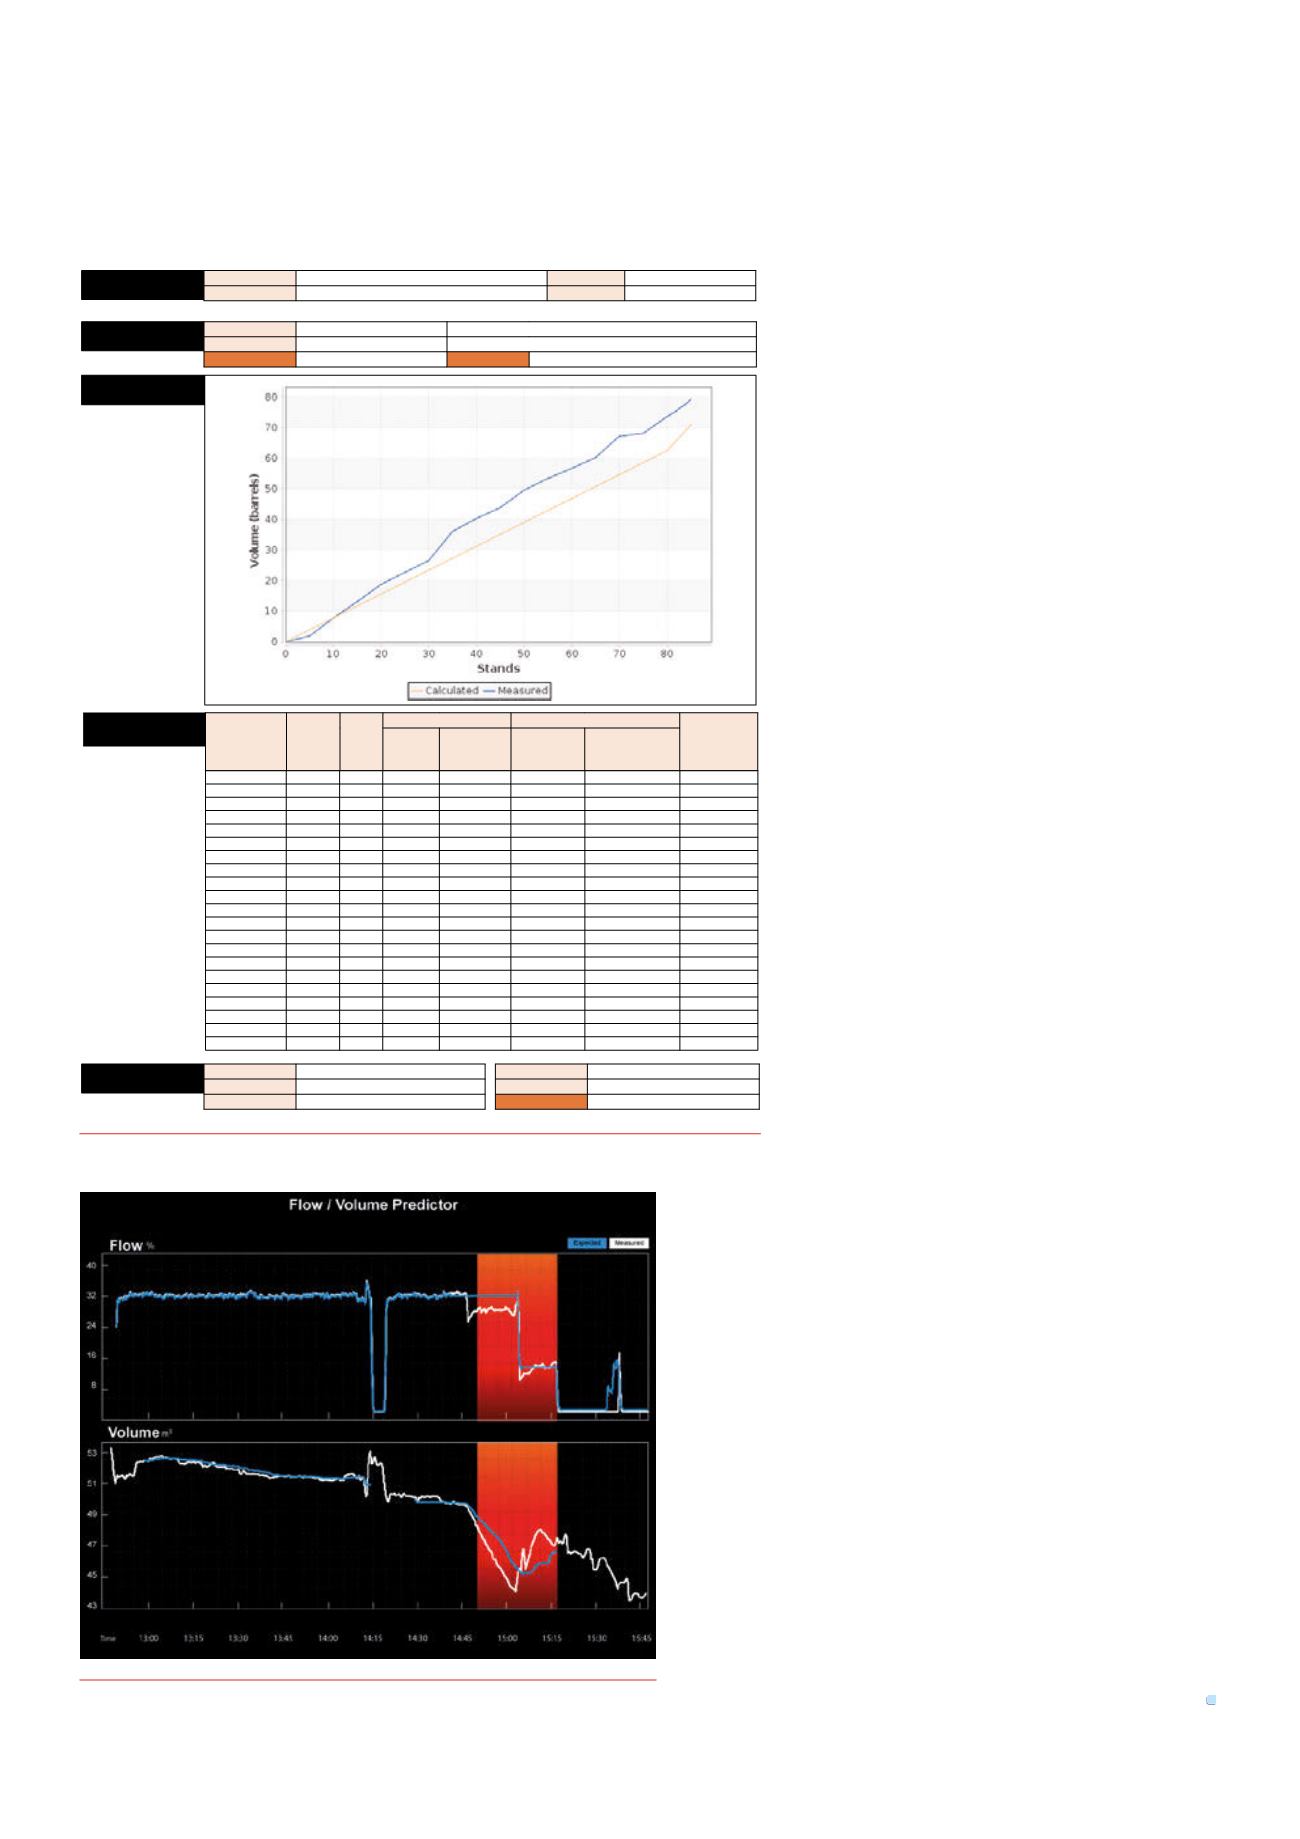
Figure 1.
Pason trip report.
Figure 2.
The ePVT detects a loss duringdrilling.


