)
)
Varying intensity of ‘rumble’ signature – actually a
complex signal that can vary from rumble to a more
complex picture as the degree of interference fit changes.
)
)
Speed of transit of the cleaning device (maximum and
minimum alerts).
)
)
Pressure pulse reflections from other pipeline furniture
(e.g. block valve in this case).
)
)
Lower intensity pulses caused by the stiction of the
normal transit in the pipe.
)
)
Varying intensity of the pulse signal.
By plotting these over an extended period, the transit of
the pig across the complete pipeline can be observed and
plotted. In this situation, the centre line trend of the device
location is easily observed over a longer distance (~30km in
this instance). Superimposed upon this are evident deviations
in the pattern discussed:
)
)
Systematic increase in perceived noise level as the device
comes closer to the fibre optic interrogator – this is
an artificial effect (optical not acoustic)
pertaining to different gain levels along the
fibre and is easily compensated for.
)
)
Areas of stronger signal – indicating
sections with a closer interference fit/
bends etc.
)
)
Evident departures from the straight
line ‘V’ signal – caused by departures
from linearity in the fibre/pipeline
relationship/moiré optical fringe
effects.
The behaviour of the signals
throughout is quite sufficient for spot
position monitoring, speed profiling
and overall average speed of transit.
The appearance does vary with pipeline
pressure and product – for example in
a low pressure gas pipeline, only the
centre ‘rumble’ may be present where the
‘V’ structure may not develop – in these cases alternative
methods are available for tracking using the rumble itself.
Live position tracking and accuracy
Having raised the ability to detect the location of a device
transiting a pipeline to a ~10 m accuracy, an obvious
application is the monitoring of speed of transit – where
the operator may be seeking to be informed about slowing
conditions to prevent a stall, locating a stuck pig, monitoring
a stuck pig via pressure unbalancing or simply monitoring the
speed profile as an aid to plotting dynamic flow or pressure
distribution in a multiple take off line.
Although live tracking of the device is provided via the
GIS (icon on map) the dynamic waterfall traces are illustrative
in terms of visualising the speed content – in this domain,
distance is horizontal, time is vertical and therefore unmoving
acoustic elements appear as vertical continuous signals and
the faster an item moves the more horizontal it appears. The
speed of the pig is therefore tracked, both from a detection
perspective at each point, but also easily visualised over a
longer time trace.
By monitoring the speed of the device over an extended
period, the overall speed of the transit can be plotted. In
variable flow or pressure conditions, speed variations are
largely conform to this flowrate variable, but in static flow
conditions, speed variations will indicate the severity of
obstructions in the pipeline (or the accumulation of wax for
example) and can be used to deliver feedback to additive
injection operations or frequency of cleaning analysis. Such
figures provide an important database for year-on-year
comparison.
Benefits of online pig tracking
There are many advantages to the use of an online tracking
system and all can save considerable effort in time and
resources and in more austere locations improve personnel
safety.
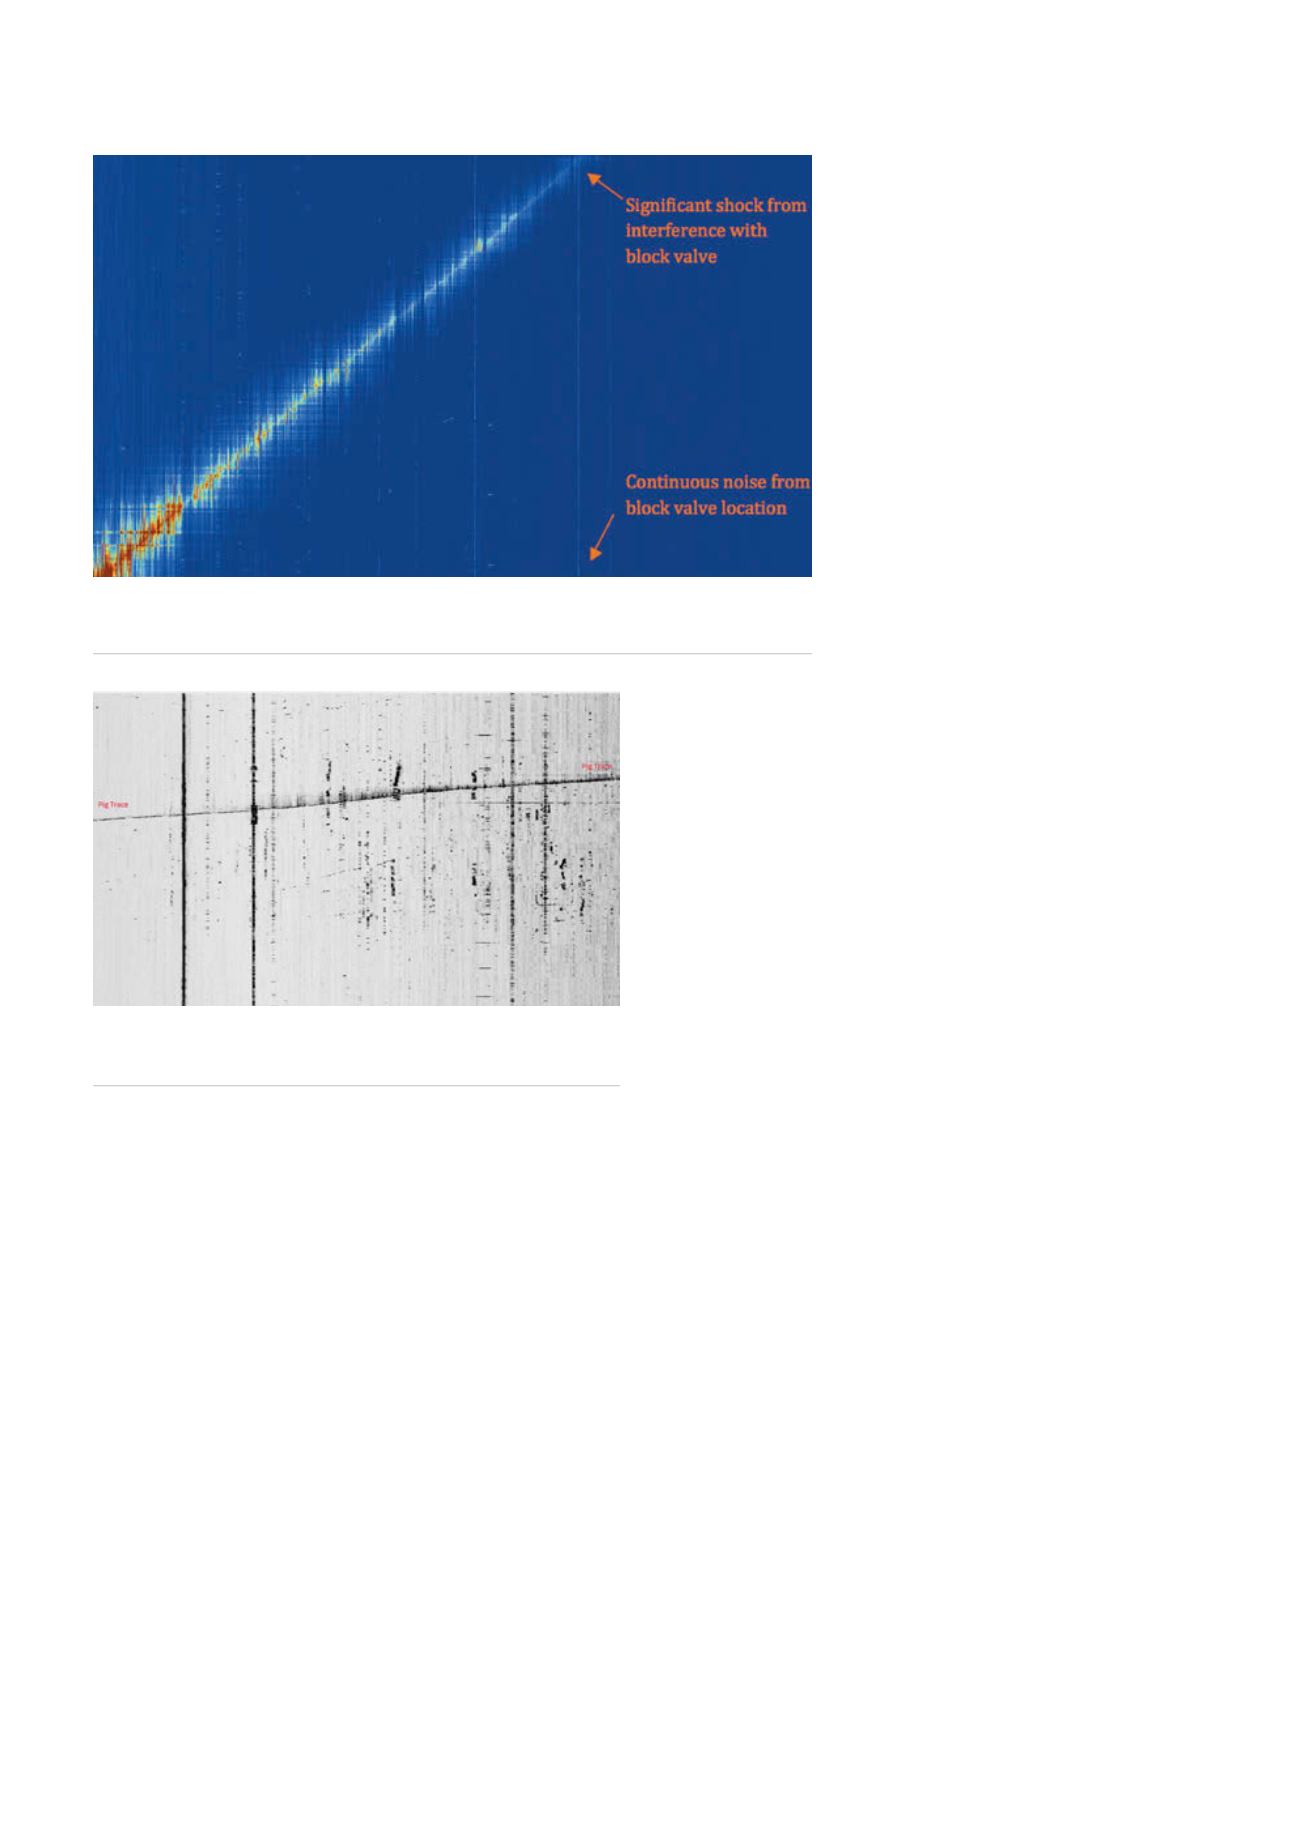
Figure 3.
Zooming to 4 hr, 30 km reveals some fading of the signal with distance (range
of interrogation) but still with sufficient strength to track over the equipment range. An
interference signal from a block valve is evident around the 27 km mark.
Figure 4.
Examples from a wet gas distribution pipeline
operation in India where the pig (travelling left to right)
experiences speed changes from changing pressure profile.
88
World Pipelines
/
FEBRUARY 2016


