48 |
Oilfield Technology
June
2016
entire Middle Bakken is 0.02 mD. Mercury injection capillary pressure
(MICP) data indicated that irreducible water saturation was between
30 - 40% for rock with and residual oil between 30 - 40%. Petrophysical
evaluation suggests that the Upper part of the Three Forks had oil
potential.
Average reservoir parameters for the upper Three Forks facies
are 8% porosity, 60% water saturation and permeability < 0.02 mD.
Irreducible water saturation was estimated as 45 - 55% for good and
poor quality rock respectively; residual oil is estimated at 40 - 55%
for good and poor quality rock respectively. In this area, the middle
and lower Three-Forks have higher water saturation, with very low
permeability streaks (< 0.007 mD).
Geomechanics
A key parameter in the iteration of various mechanical earth models
(MEMs) was the pore-pressure profiles. A pore pressure transition
region into the Lodgepole (Scallion formation), was created
where a linear pressure increase from salt water gradient up to
the estimated pore-pressure of the Upper Bakken Shale. For the
TRFK, a linear decrease of pore-pressure from over-pressured in
the Lower Bakken Shale to normal pressure was generated within the
first 100 ft. The pore pressure remained elevated across the pronghorn
and first two TRFK benches, and then reduced back to a salt-water
gradient for the remaining TRFK benches.
Fracturemodelling -MiddleBakken
For the Middle Bakken: Micro-seismic and
the diagnostic fluid injection test (DFIT) data
together with interference information from 355
offset fractures with 47 communication events,
constrained the expected geometry height growth
and an expected fracture length, in both the MB
and TRFK. For the Three Forks: micro-seismic data
and interference information from 134 fractures
with 28 communication events constrained an
expected geometry height above and below the
TRFK, and a minimum expected fracture length in
the MB and the TRFK.
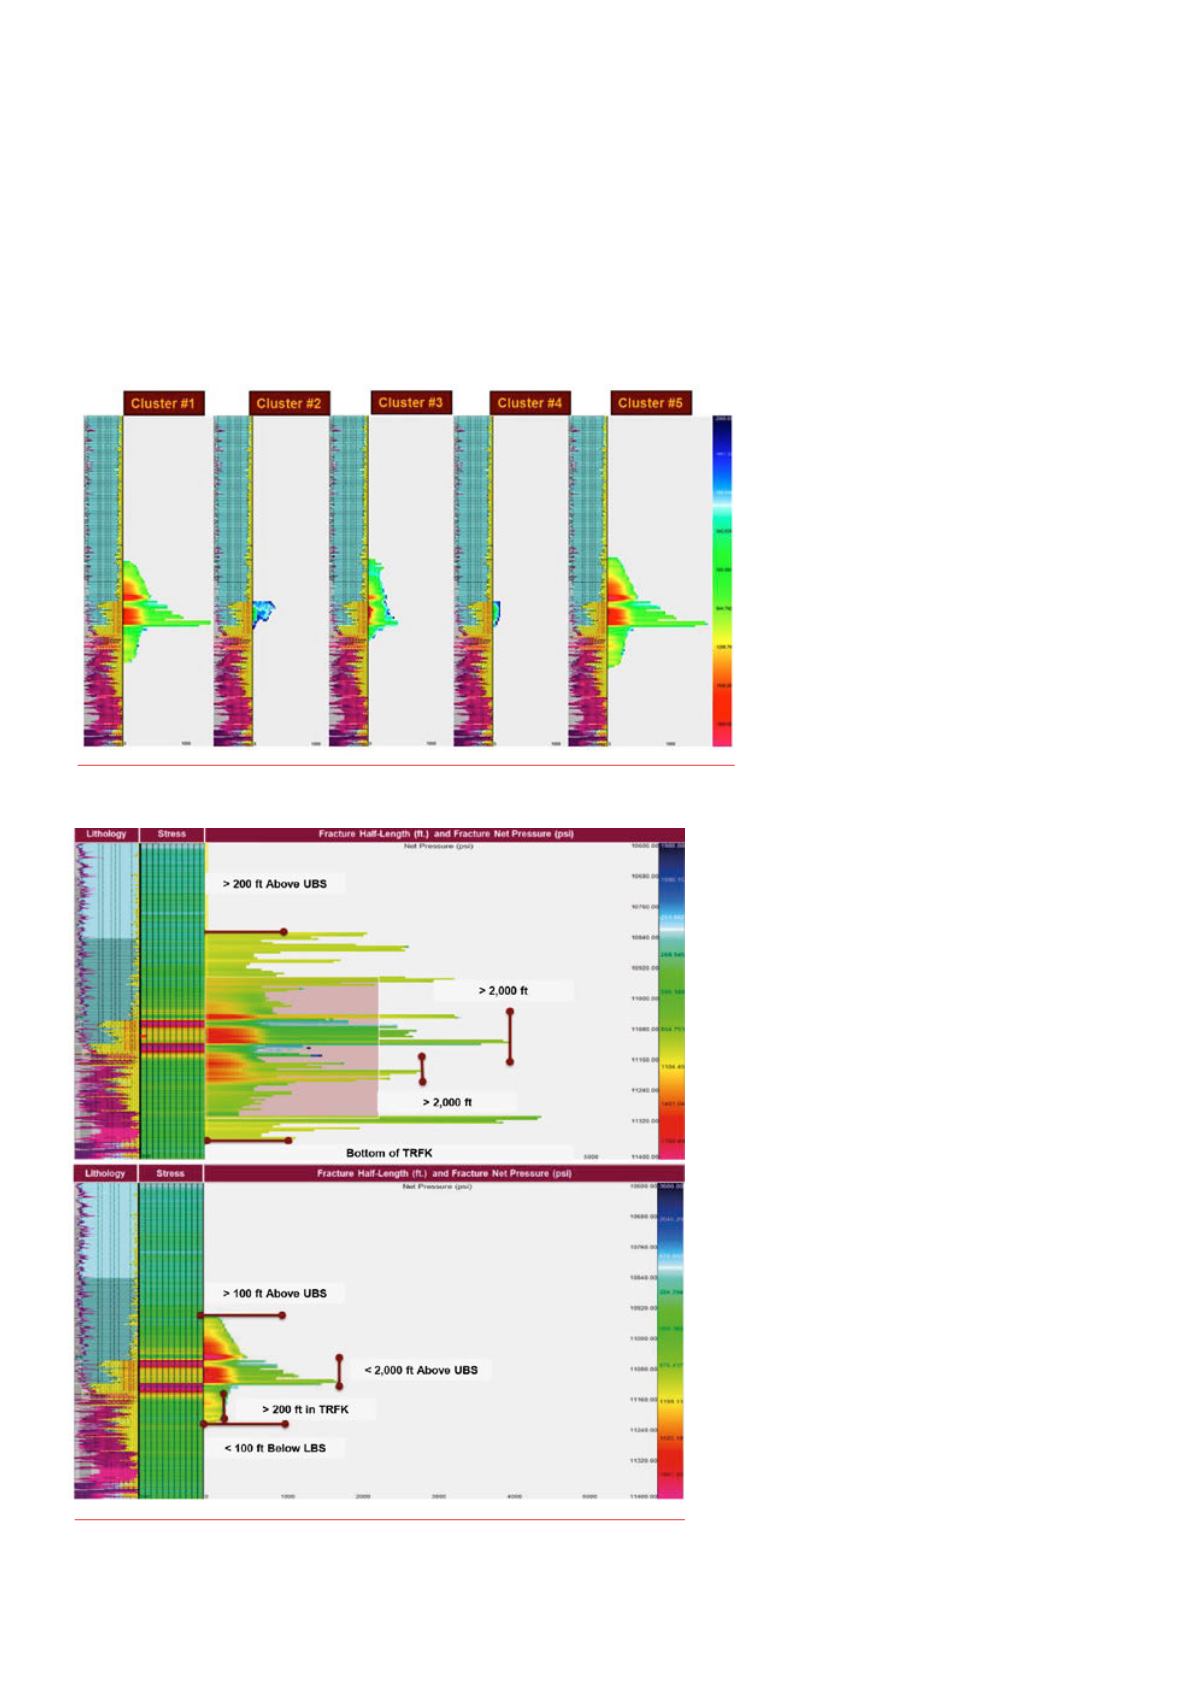
Analysis on the Bakken wells in the study
area indicated high (> 1500 psi) net-pressures
and low breakdowns. This implies that a
plug-and-perf (PnP) completion methodology
could yield success by enabling multiple
perforating clusters (within a stage) to breakdown,
especially when high pump rates (typical of slickwaters)
are utilised (Figure 1). When parent well sliding-sleeve (SS)
treatments were modelled (Figure 2), a large single
dominant fracture was observed (via fracture modelling
and production modelling). When parent well PnP
treatments were modelled (in the same area), propagation
of multiple fractures was confirmed by both fracture and
production modelling. Fracture modelling indicated that
two dominant fractures were propagating.
Productionmodelling
For the Bakken model, the upper and lower shale were
modelled, together with the Middle Bakken. Daily
bottom-hole pressures (BHP) were computed and
calibrated to BHP gauge data on offset wells to select the
appropriate flow – correlation. Compaction curves were
generated from core data and utilised to model fracture
conductivity and permeability degradation. The SS Middle
Bakken well has a permeability of >0.01 mD, maximum
fracture half-length of 250 ft and a dimensionless fracture
conductivity that reduces from seven to four. Flowing
bottom-hole gauge data was used to constrain the history
match (Figure 3). Compaction curves from core and
proppant were utilised to model degradation of proppant
conductivity and rock compaction (permeability/porosity
reduction). An ‘additional damage’ factor (using
compaction curves) had to be added after two years of
production to match the fluid level measurements. This
damage increased with time. The initial hypothesis was
proppant crushing (since effective stresses were close to
6000 psi – crushing pressure of sand).
Figure 2.
Comparison of sliding-sleeve (single fracture) andplug-and-perf geometries
(dominant cluster of three).
Figure 1.
Typical fracture geometry variation expected ina stage.


