The CP coupons provide native and ON/OFF potentials
of the individual pipelines minimising the measurement
error. They also provide information on the current
demand of bare steel to achieve the desired protection
level in soil surrounding the pipe. The soil resistivity survey
and soil maps provide information on the type of soil and
its corrosivity.
Predicting the corrosion and CP polarisation behaviour
of the pipe is accomplished by combining the coupon
data with soil information. The RMUs of the rectifiers
monitor the total current output (current demand) of each
individual pipeline in a specific region.
The inline cathodic current mapping inspection tool
(smart pig) measures the voltage drop caused by the axial
CP current that flows in the pipeline wall. The data set
provides an appreciation of the coating condition, which is
used to localise and quantify the current exchanged with
other structures of influence (e.g. bonding between pipes,
shorts to ground).
The field data, pipeline properties and the
characteristics of the CP system are consolidated in
a computational model that enables calculating true
protection levels of the individual pipelines.
Connecting the dots
Advances in electronics and portable power capacity
over the past 20 years have now enabled unprecedented
access to immense volumes of information that can be
transmitted almost instantaneously from remote locations
very economically. The ‘big data’ needs to be stored,
visualised and, most importantly, analysed and evaluated
in a practical and cost-efficient manner. Moreover, the
abovementioned field data provides valuable information
on individual parameters, but a correlation must be made
between the data, which is not an easy task for such a
complex system.
For example, the ON potential is determined by
the coating resistance, soil resistivity and CP current
distribution. The axial current is a result of the CP current
distribution on the pipe, but does not provide information
on whether or not the minimum pipe-to-soil potential of
-850 mV or 100 mV polarisation shift is achieved at the
pipe surface of a complex multiple pipeline corridor. An
intelligent analysis tool is required to automatically treat
the large set of data and unambiguously find correlations
between the pipeline and CP parameters to objectively
draw the correct conclusions.
The Elsyca CatPro software is a BEM/FEM based
computational tool that simulates the CP and corrosion
behaviour of e.g. multiple pipeline corridors. The software
connects the dots by integrating all the field data and
system properties in a 3D physical model of the pipelines
and CP components. All relevant parameters such as
the exact pipeline routing based on GPS co-ordinates,
location/geometry of anode beds, cabling to rectifiers,
bonds between pipelines, drains to groundings etc. are
assimilated. Such a model calculates the CP current
distribution in the soil, and determines the polarisation
level as a function of the coating resistance of the entire
pipeline corridor.
Firstly, the coating resistance is estimated based on the
coating type, pipeline vintage and local soil resistivity. The
monitored current output of the rectifiers is applied in the
model and an initial simulation is obtained that provides
results on:
)
)
Pipe-to-soil ON potential at grade level or at any depth.
)
)
IR-free potential at pipeline surface.
)
)
Current density leaving/
entering the pipeline.
)
)
Axial current through the
pipe wall.
)
)
Rectifier voltage and
current output.
)
)
Current through bonds
and drains.
Parameters such as
ON potential and current
flow (axial current through
the pipeline wall, rectifier
output and current exchange
through bonds and drains)
are used to calibrate
the model for the as-is
condition. The simulation
results are again compared
with the measured field
data and if a discrepancy is
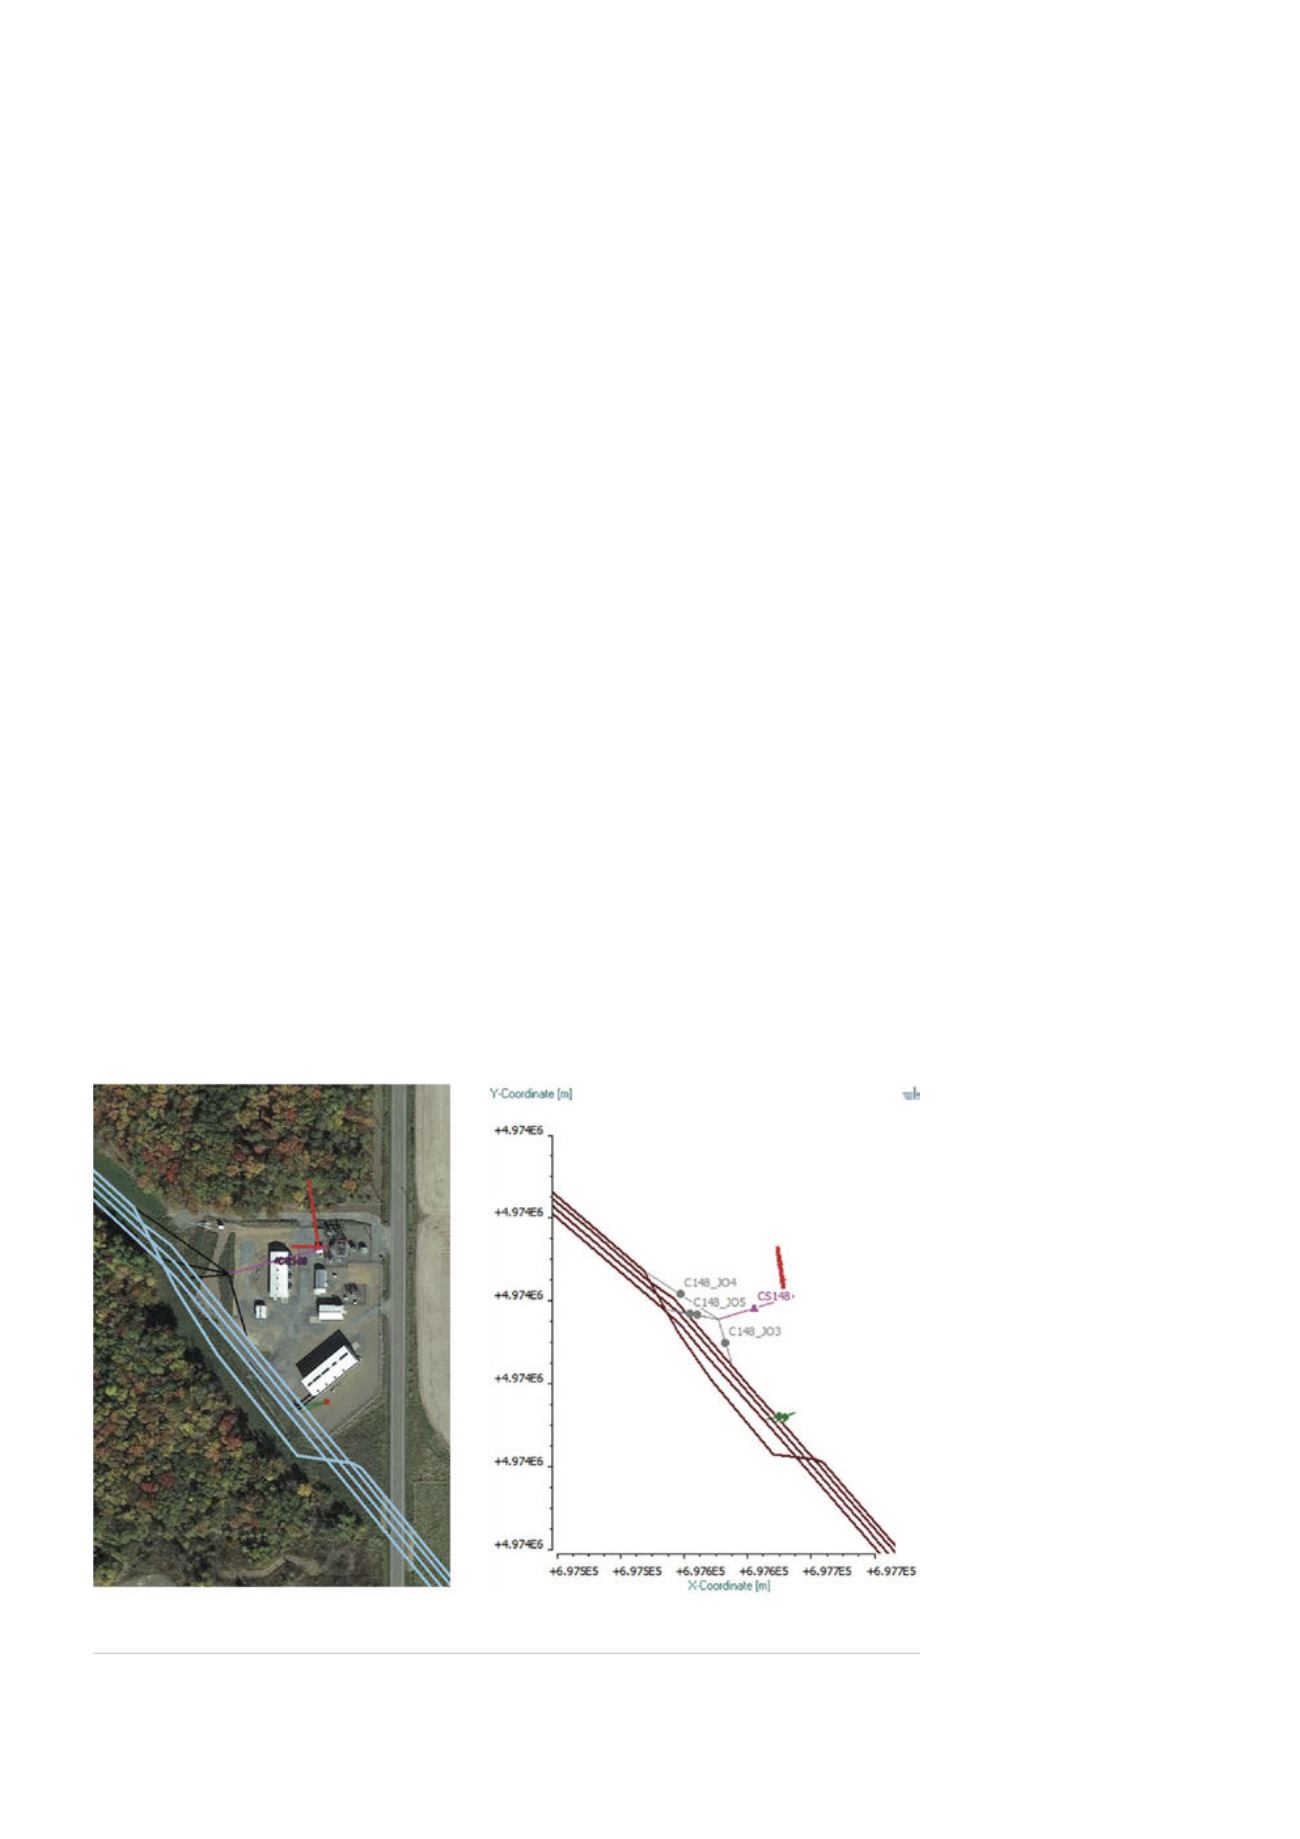
Figure 3.
3D computational model of pipeline corridor with CP system (red line) and electrical
shortings (green line).
28
World Pipelines
/
FEBRUARY 2016


