cathodic protection system is critical. Has the system
been upgraded, have rectifiers been replaced or ground
beds or bonds added? Complete information greatly
assists the CIPS crew in planning and implementing close
interval survey work.
Select the CIPS type
CIPS surveys come in a variety of forms, including native
potential, depolarised, on potential and instant off, or
on-off interrupted potential that can be summarised into
two basic groups:
)
)
On potential and on-off interrupted potential surveys
are used to determine if the -850 MV criteria is being
achieved. These are the most common surveys and
are often preferred because they typically require
only a single pass over the ROW.
)
)
Native potential and depolarised surveys establish a
baseline for using the -100 MV shift criteria. This criteria
requires survey data on the potential of the structure
without CP applied and then survey data once the
current is applied so that it is possible to confirm that a
minimum shift of -100 MV has been achieved. Since the
-100 MV shift criteria requires two data sets to measure
the shift in potential they are often used only when the
-850 MV criteria is not easily achieved.
Collect the CIPS data
Once the close interval survey method is determined, CIS
crews gather data in the field with specialised equipment
by walking the length of the pipeline being surveyed. A
typical crew can effectively average about five miles per
day in moderate terrain, although a variety of factors can
affect the data collection rate.
For all CIPS surveys it is very important to identify
all of the potential current sources that might impact
the pipeline in the survey area. This would include the
pipeline’s CP systems and those CP sources that are in
the same area and could potentially have an influence
on the pipeline. There are a variety of other factors
that can impact the quality and integrity of the data
being collected. It is also quite important that the data
being collected is properly tagged to a specific location.
With today’s sub-metre (and even sub-centimetre) GPS
technology, almost all CIPS survey data is now tagged
with a specific GPS location for every data point to
facilitate data alignment.
CIPS data analysis and reporting
Close interval survey data and reports typically include
regular daily or weekly field progress reports during
the survey and complete data and final reports upon
completion of the survey. Often the raw data collected
needs to be processed by a data analyst to align the
data sets and the GPS data and to eliminate spurious
readings.
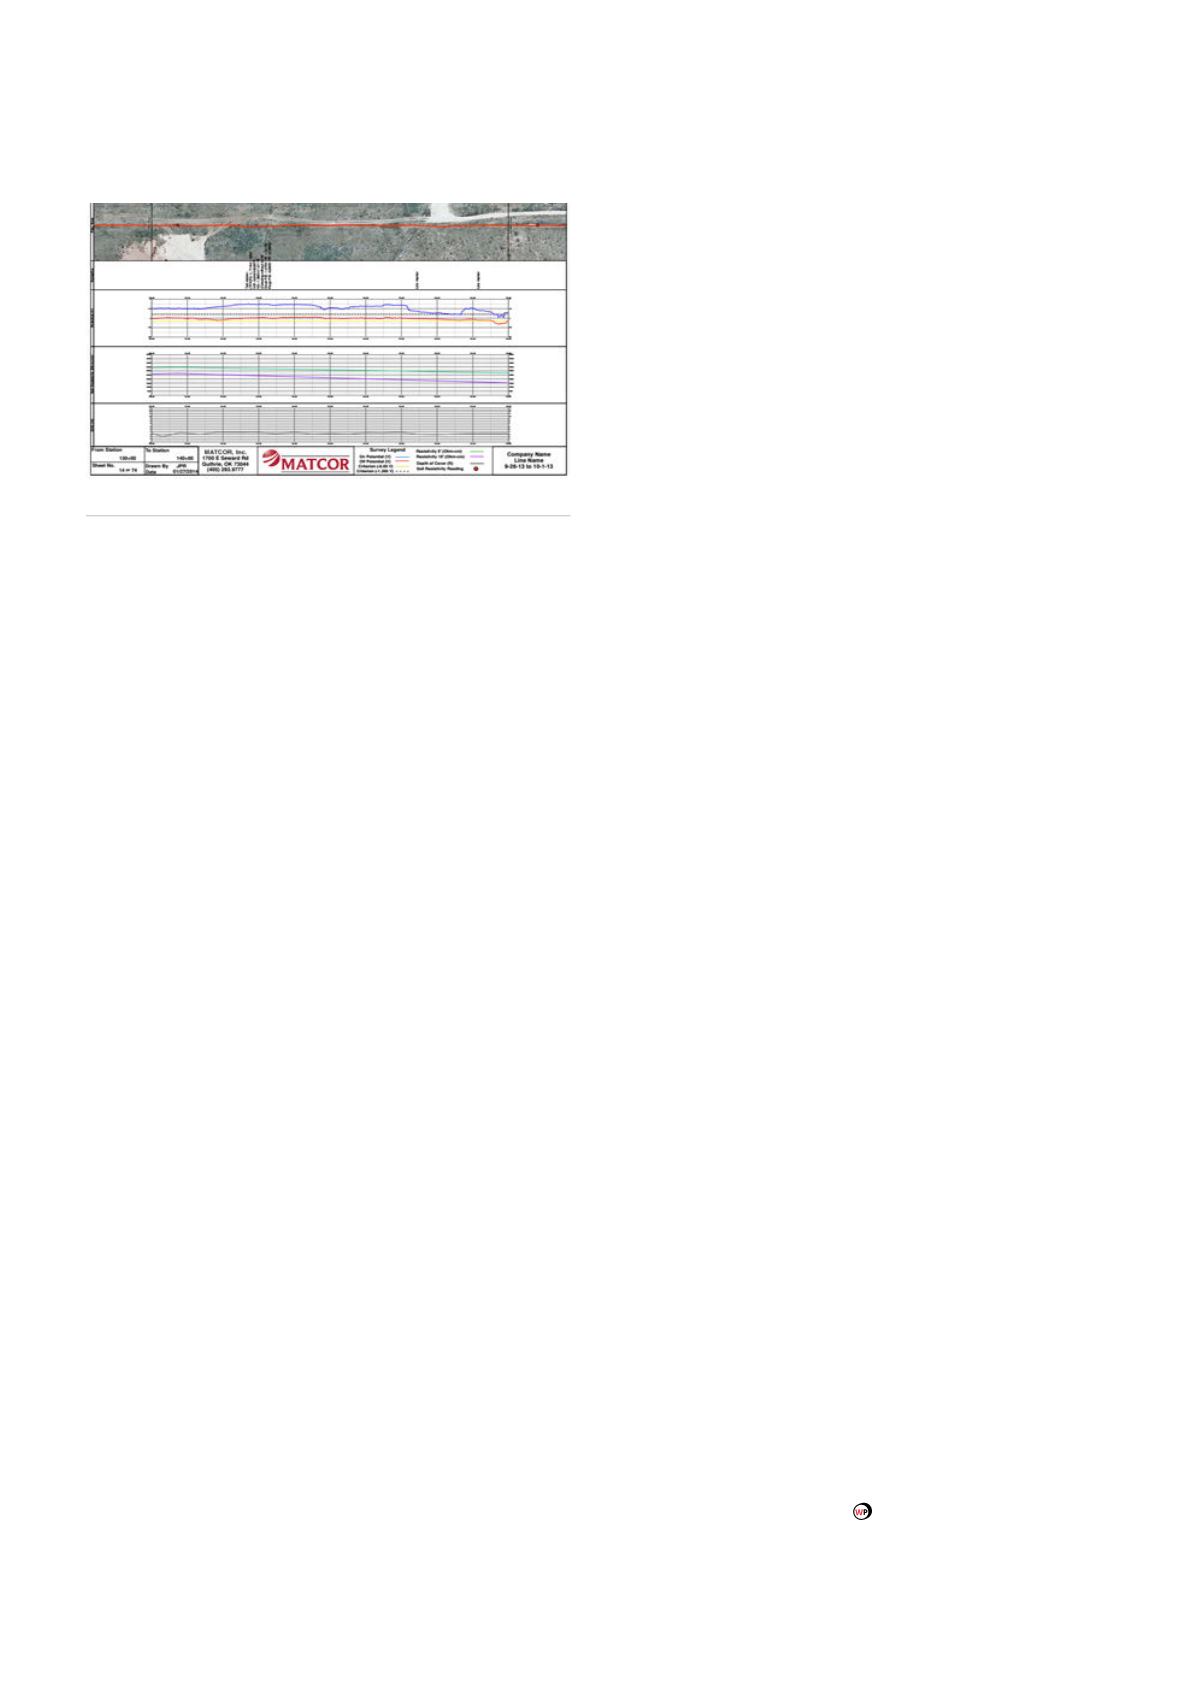
Final reports typically include the raw data set, the
processed data, graphs/plots of the data, operating
details of the CP system at the time the data was
collected, ROW conditions, and any external effects on
the pipeline by other sources. Good CIS data fits right
into the pipeline GIS and compliance systems utilised
by most operators. Final CIS reports may also include an
engineering report that details the current status of the
pipeline and any potential issues that may arise from
the survey findings.
Other considerations
In some cases, CIPS surveys may be especially
challenging or conditions may make it infeasible to
collect data. This would include:
)
)
Piping that is located especially deep where potential
readings may not be accurate.
)
)
Pipelines installed in rock bores or with casings
where potential readings cannot be attained.
)
)
Areas of coating disbondment that can provide false
readings.
)
)
Frozen soils, paved roadways and very dry, rocky soils
that may not allow for accurate potential readings.
)
)
Areas under the influence of telluric earth currents or
DC transit interference.
)
)
Congested plant environments with significant plant
earthing or grounding networks.
These should be identified during the planning phase
and alternative integrity assessment methods or tools
may be required.
CIPS surveys are an effective and proven tool in the
pipeline operator’s integrity programme that can be used
to assess the effectiveness of the pipeline’s CP systems
and to identify areas of corrosion risk. When performed
on a regular basis they can be used to evaluate coating
degradation and provide information on areas requiring
additional supplemental CP.
Figure 3.
CIPS alignment sheet data presentation.
36
World Pipelines
/
FEBRUARY 2016


